> ## Documentation Index
> Fetch the complete documentation index at: https://docs.valiyou.com/llms.txt
> Use this file to discover all available pages before exploring further.
# Reports
> Generate comprehensive valuation reports with PDF exports, stakeholder presentations, and advanced data export. Compare valuations with trend analysis and AI.
# Valuation Reports & PDF Exports
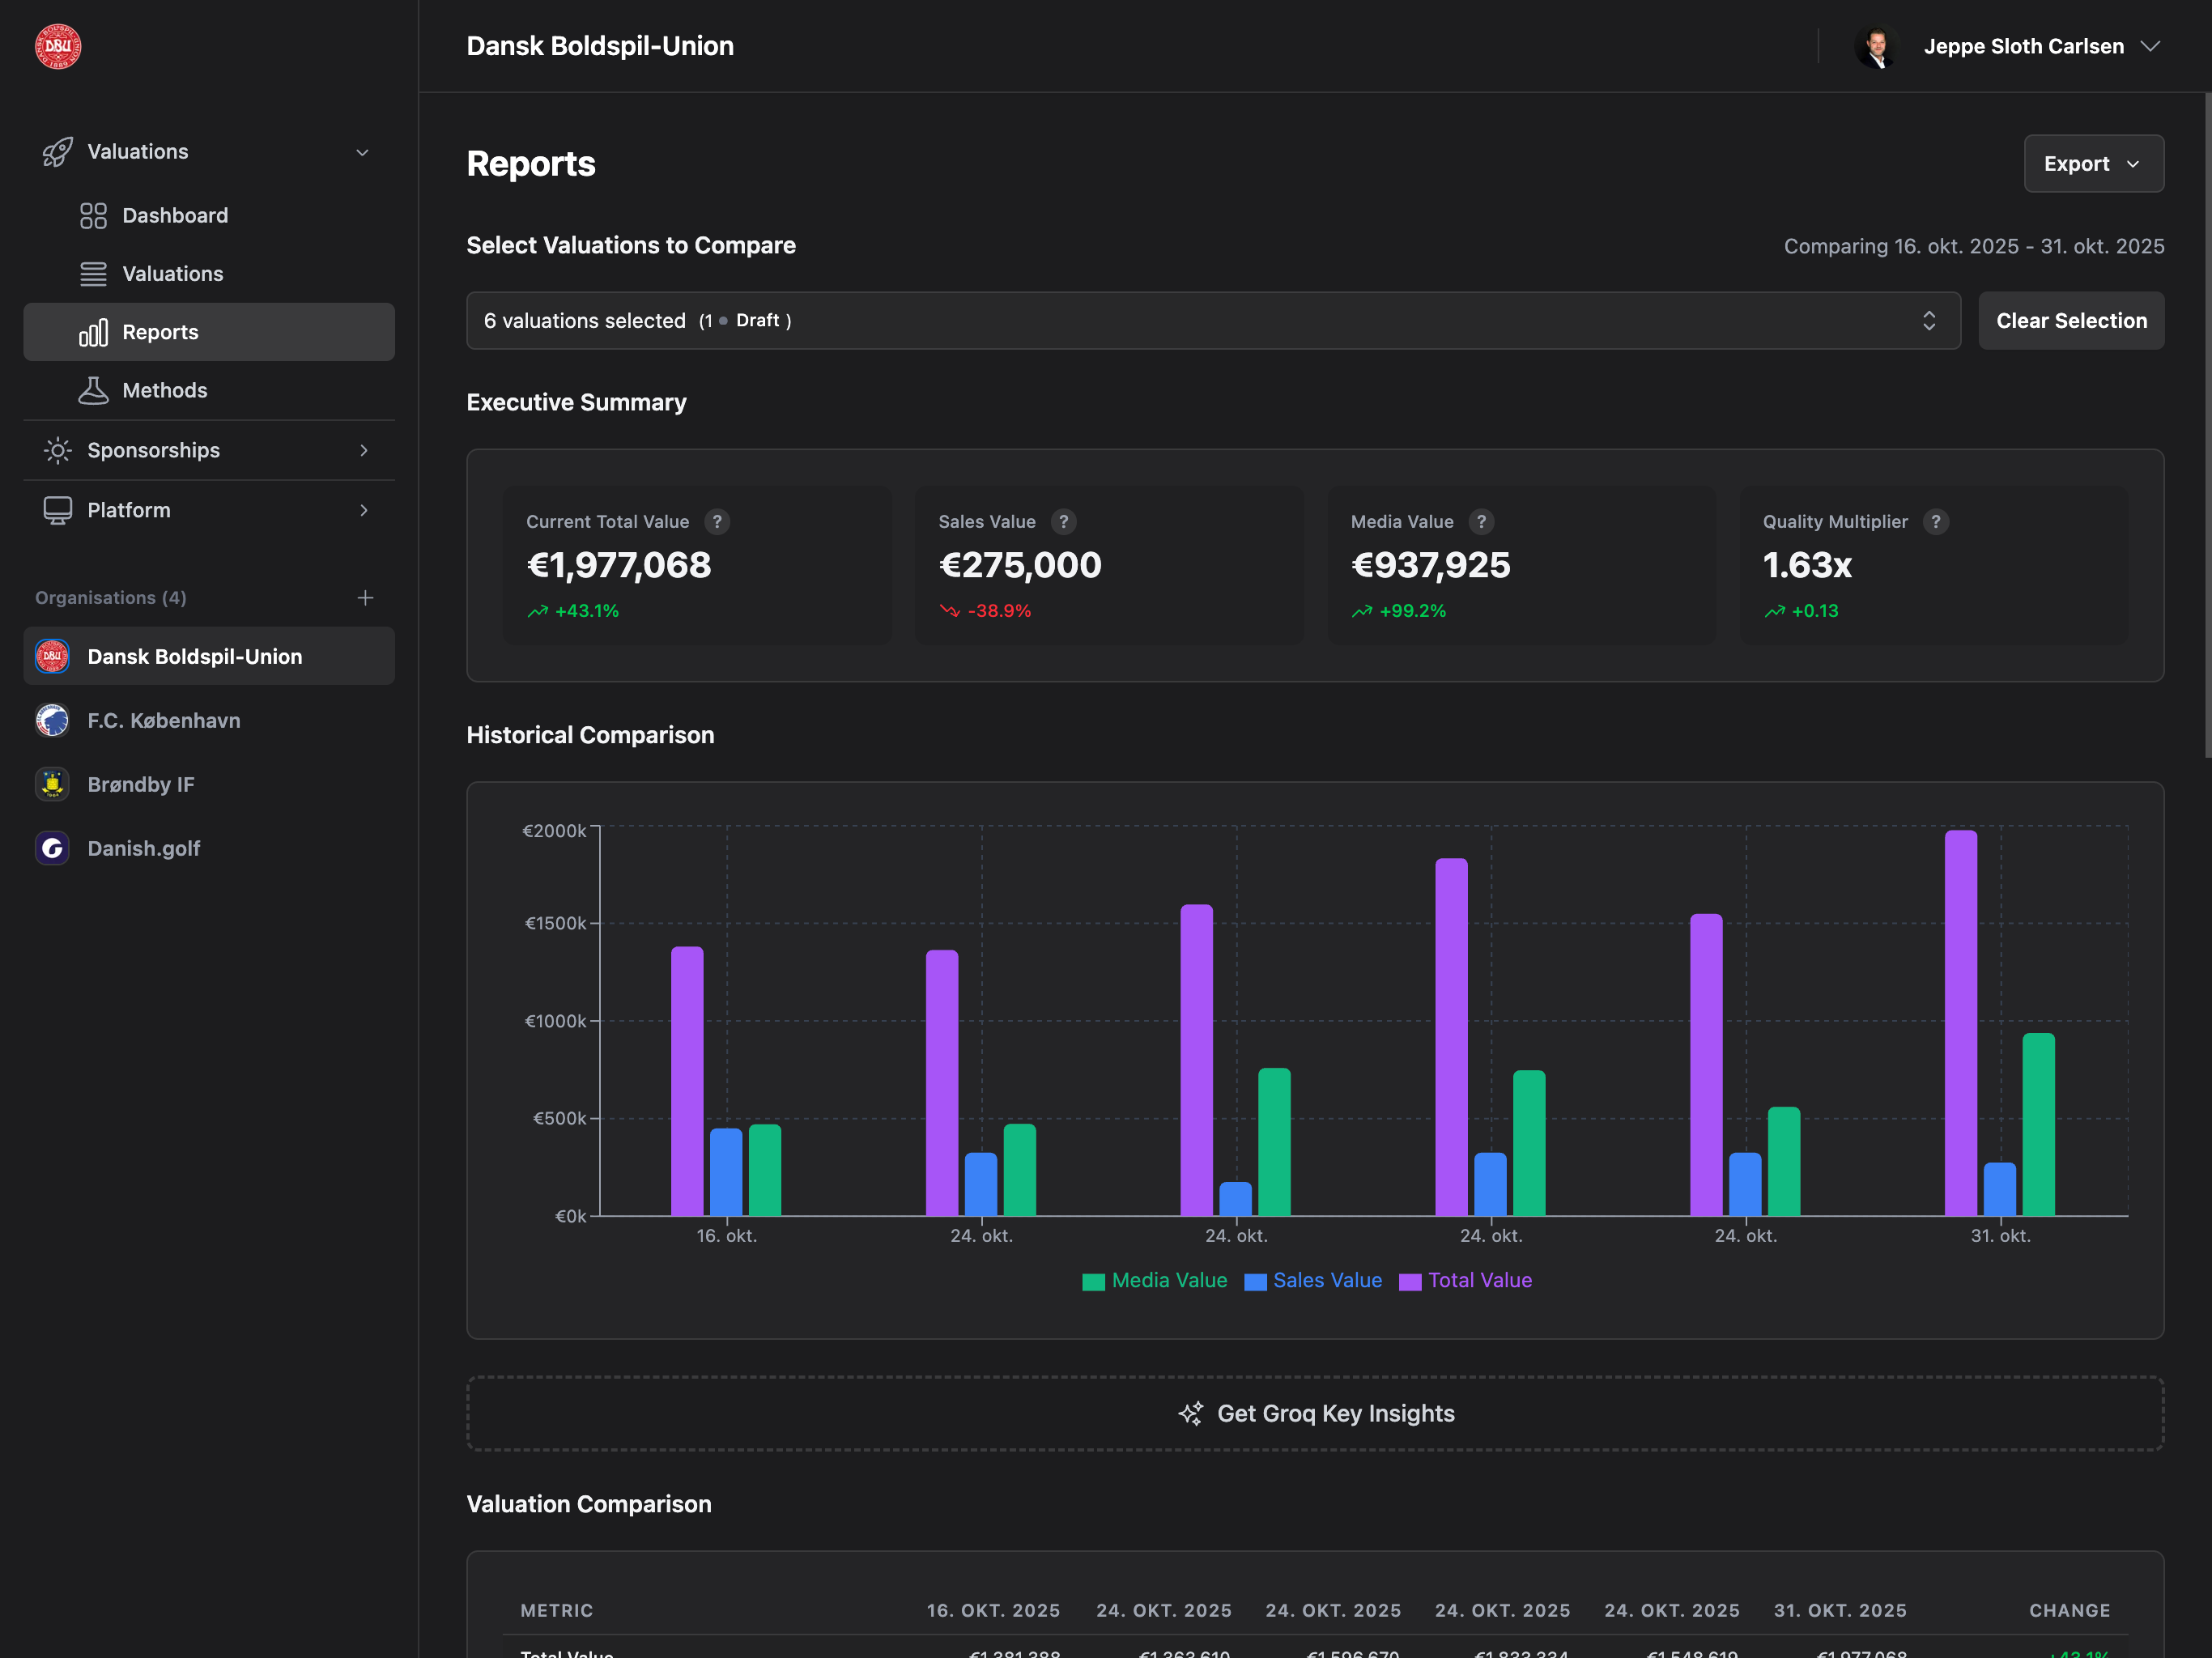 **Create professional valuation reports for stakeholder presentations** with comprehensive PDF exports, branded reports, and advanced data analytics. Compare multiple valuations side-by-side, generate AI-powered insights, and export presentation-ready documents that demonstrate your sponsorship value with credibility and clarity.
Generate comprehensive reports by comparing multiple valuations side-by-side with trend analysis and AI insights.
## Accessing Reports
Navigate to **Valuations** → **Reports** from the sidebar to access the reports page.
**Permission Required**: You need Reports role or Admin access to view reports.
## Empty State
If you don't have any valuations yet, you'll see:
* **Icon**: Chart graphic
* **Title**: "No Valuations Yet"
* **Message**: "Create your first valuation to get started"
* **Action**: "Create First Valuation" button
## Report Configuration
At the top of the page, configure which valuations to compare.
### Valuation Multi-Select Dropdown
**Label**: "Select valuations..." (or "X valuations selected")
**Features:**
* Multi-select dropdown (select multiple valuations)
* Shows valuation dates as options
* Draft badge for draft valuations
* Checkmark indicator for selected items
* Shows count: "X valuations selected"
* Draft count: "(X Draft)" badge if any drafts are selected
**Auto-Selection**: By default, the newest 2 valuations are automatically selected when you first
open the page.
### Selection Persistence
* Your selection is saved in browser storage
* Returns to your last selection when you revisit the page
* Persists across browser sessions
* Per-organization (different selection for each org)
### Clear Selection Button
**Button**: "Clear" (appears when valuations are selected)
**Action**:
* Removes all selected valuations
* Clears saved selection from storage
* Prevents auto-selection on next visit
Select at least **2 valuations** to generate a report and see comparison charts.
## Report Empty State
**Displays when**: Fewer than 2 valuations are selected
**Message**:
* Icon: Chart graphic
* Title: "Select At Least 2 Valuations"
* Description: "Choose at least two valuations from the dropdown above to generate a report"
## Executive Summary
**Displays when**: 2 or more valuations are selected
Four summary cards showing key metrics from the **newest** selected valuation with trend indicators:
### Total Attention Valuation
**Display**: Final total value (e.g., "€125,000")
**Trend**: Percentage change from oldest to newest (e.g., "+15.2%")
**Color**: Green (increase), Red (decrease), Gray (no change)
### Sales Value
**Display**: Total sales value
**Trend**: Percentage change
**Color**: Green/Red/Gray based on trend
### Media Value
**Display**: Total media value
**Trend**: Percentage change
**Color**: Green/Red/Gray based on trend
### Qualitative Multiplier
**Display**: Brand multiplier (e.g., "1.15x")
**Trend**: Absolute change (e.g., "+0.05")
**Color**: Green/Red/Gray based on trend
Trends compare the **oldest** selected valuation to the **newest** selected valuation, not
sequential changes.
## Historical Comparison Chart
**Title**: "Historical Comparison"
A multi-line area chart showing valuation trends over time.
### Chart Features
**Three Stacked Areas:**
1. **Sales Value (Blue)** - Bottom layer
2. **Media Value (Green)** - Middle layer
3. **Total Attention Valuation (Purple)** - Top layer with brand multiplier
**Additional Elements:**
* **Grid lines** - Help read values
* **Legend** - Shows all three series
* **X-Axis**: Valuation dates (e.g., "Jan 15")
* **Y-Axis**: Currency values
**Interactive**: Hover over any point to see exact values for Total, Sales, Media, and Multiplier
for that date.
### How to Read
* **Upward trend** - Value is increasing
* **Downward trend** - Value is decreasing
* **Flat** - Value is stable
* **Distance between lines** - Shows contribution of sales vs media
## AI Insights
**Plugin Required**: AI Insights require the AI Insights for Reports plugin
(Professional/Enterprise plans). See [AI Insights for Reports](/platform/plugins/ai-insights) for
setup details.
### Enabling AI Insights
**To enable:**
1. Go to **Platform** → **Plugins**
2. Find "AI Insights for Reports" plugin
3. Click "Enable"
4. Configure AI provider (Groq, Google Gemini, OpenAI, Anthropic, or OpenRouter)
5. Enter API key
6. Optionally customize prompt
See [AI Insights Configuration Guide](/platform/plugins/ai-insights#configuration) for detailed setup instructions.
### Generate Insights Button
**Button**: "Generate AI Insights" (blue primary button with sparkles icon)
**Action**:
* Sends selected valuations to AI for analysis
* Generates insights about trends, patterns, and recommendations
* Shows loading spinner while processing
**Displays when**: AI Insights plugin is enabled and valuations are selected
### Insights Display
**Card Title**: "AI Insights" with provider badge (e.g., "Powered by Groq")
**Insight Items**:
* Icon: Sparkles, Bolt, CPU Chip, or Beaker (randomly assigned)
* Title: Bold insight summary
* Description: Detailed insight text
* Multiple insights per report (typically 3-5)
**Empty State** (before generating):
* Icon: Sparkles
* Message: "No insights generated yet"
* Subtitle: "Click 'Generate AI Insights' to analyze your valuations"
**Saved Insights**: Insights are cached in browser storage for your current selection. They'll
reload automatically if you return to the same selection.
### AI Provider Options
**Supported Providers:**
* **Groq** - Fast and cost-effective
* **Google Gemini** - High quality insights
* **OpenAI** - GPT-powered analysis
* **Anthropic** - Claude-powered analysis
**Provider Badge**: Shows which AI generated the insights (e.g., "Powered by Google Gemini")
### Custom Prompts
You can customize the AI prompt in plugin settings to:
* Focus on specific metrics
* Request specific analysis types
* Add context about your organization
* Tailor tone and language
### Common Errors
**"AI Insights plugin is not enabled"**
* Go to Plugins and enable AI Insights
**"AI Insights is not configured"**
* Add your API key in plugin settings
**"Response was truncated due to length"**
* Try selecting fewer valuations
* Reduce custom prompt length
**"AI quota exceeded"**
* Check your API provider plan limits
* Upgrade plan or wait for quota reset
**"AI service is temporarily overloaded"**
* Wait a moment and try again
## Valuation Comparison Table
**Title**: "Valuation Comparison"
A table comparing key metrics across all selected valuations.
### Desktop Table
**Columns:**
* **Metric** - Metric name (left-aligned)
* **\[Date 1]**, **\[Date 2]**, etc. - One column per selected valuation (right-aligned)
* **Change** - Percentage change from oldest to newest (right-aligned)
**Rows:**
1. **Total Value** - Final total valuation
2. **Sales Value** - Total sales revenue
3. **Media Value** - Total media value
4. **Quality Multiplier** - Brand multiplier (shows absolute change, not percentage)
**Colors:**
* Green: Positive change (increase)
* Red: Negative change (decrease)
* Gray: No change
### Mobile View
Instead of table, shows one card per valuation with all metrics:
* Valuation date as card title
* Total Value
* Sales Value
* Media Value
* Quality Multiplier
## Sales Breakdown Table
**Title**: "Sales"
Detailed sales revenue comparison.
### Desktop Table
**Rows:**
* Merchandise Revenue
* Matchday Revenue
**Columns**: Same structure as Valuation Comparison table
**Change Column**: Shows percentage change for each revenue type
### Mobile View
One card per valuation showing:
* Merchandise Revenue
* Matchday Revenue
## Player Sales Table
**Title**: "Player Sales Value"
Individual player transfer breakdown.
### Desktop Table
**Rows**: One row per player sale across all valuations
* Player name in left column
* Sale value only shown for the valuation where player was sold
* Other columns are empty (players are only sold once)
* No change column (not applicable for one-time sales)
**Empty State**: "No player sales recorded in selected valuations"
### Mobile View
One card per player sale showing:
* Player name as card title
* Sale date
* Sale value
**Professional/Enterprise Only**: Player sales tracking requires Professional or Enterprise plan.
## Media Value Breakdown Table
**Title**: "Media Value"
Comparison across all six media channels.
### Desktop Table
**Rows:**
1. TV
2. Web TV
3. PR
4. Digital
5. Social (combined: followers + impressions + engagements)
6. Attendance & Hospitality (combined: attendance + hospitality guests)
**Columns**: Same structure as other tables
**Change Column**: Shows percentage change for each channel
### Mobile View
One card per valuation showing all six channels with values.
### Calculation Notes
* **TV**: Duration \_ Size Multiplier \_ CPM \* Viewers / 1000
* **Web TV**: Views / 1000 \* CPM
* **PR**: Reach / 1000 \* CPM
* **Digital**: Impressions / 1000 \* CPM
* **Social**: Sum of (Followers CPM + Impressions CPM + Engagements CPM)
* **Attendance & Hospitality**: (Attendance / 1000 \_ CPM) + (Guests \_ Value per Guest)
## Brand Value Indicators Table
**Title**: "Brand Value Indicators"
Comparison of all four brand indicators on 1-10 scale.
### Desktop Table
**Rows:**
1. Popularity
2. CSR
3. Culture
4. Fans/Loyalty
**Display**: Values shown as "X.X/10" (e.g., "8.5/10")
**Change Column**: Shows absolute change (e.g., "+0.5"), not percentage
**Colors:**
* Green: Increase
* Red: Decrease
* Gray: No change
### Mobile View
One card per valuation showing all four indicators.
## Export Options
**Button**: "Export" dropdown (top right)
Two export formats available:
### Export PDF
**Action**: Opens browser print dialog
**What's included:**
* Organization logo (if uploaded)
* Report title: "Valuation Report"
* Date range (if 2+ valuations)
* Executive Summary cards
* Historical Comparison chart
* All comparison tables (Valuation, Sales, Player Sales, Media, Brand)
* AI Insights (if generated)
**What's excluded:**
* Navigation elements
* Configuration dropdowns
* Export buttons
* Interactive elements
**Print Settings:**
* **Page size**: A4
* **Margins**: 0.8cm
* **Orientation**: Portrait
* **Colors**: Preserved
**Print-friendly**: The page automatically adjusts for printing. Insights and charts are formatted
for clear printing.
### Export CSV
**Action**: Downloads CSV file
**Filename**: `valuations-report-[first-date]_to_[last-date].csv`
**What's included:**
* All valuation fields for selected valuations
* One row per valuation
* Player sales in separate section
* Raw values (not formatted currencies)
**Use cases:**
* Import into Excel/Google Sheets
* Further analysis with other tools
* Data archival
* Integration with other systems
**2+ Valuations Required**: Export buttons only appear when you have selected at least 2
valuations.
## Common Use Cases
### Quarterly Performance Review
1. Select last 4 quarters' valuations
2. Review Historical Comparison chart for trends
3. Generate AI Insights for recommendations
4. Export PDF for board meeting
5. Use insights to set next quarter goals
### Sponsor Proposal
1. Select valuations from target period
2. Show growth in Executive Summary
3. Highlight positive trends in media channels
4. Export PDF for sponsor presentation
5. Use AI Insights for narrative
### Budget Planning
1. Compare current year vs previous year valuations
2. Analyze which channels drive most value
3. Export CSV for financial modeling
4. Use insights to allocate marketing budget
5. Set targets based on trends
### Performance Benchmarking
1. Select valuations at regular intervals
2. Compare Sales vs Media value trends
3. Check brand indicator consistency
4. Generate AI Insights for patterns
5. Share report with management team
## Permissions
Different permissions show different content:
| Permission | Can Access | Can Generate Insights | Can Export |
| ---------------- | --------------- | ------------------------- | ---------- |
| **Reports Role** | ✅ Yes | ✅ Yes (if plugin enabled) | ✅ Yes |
| **Admin** | ✅ Yes | ✅ Yes (if plugin enabled) | ✅ Yes |
| **Other Roles** | ❌ Access Denied | ❌ No | ❌ No |
**Reports-Only Access**: You can grant team members the Reports role without other valuation
permissions. They can view reports but not create or edit valuations.
## Troubleshooting
### No Valuations Appear in Dropdown
**Check:**
* Valuations exist in your organization
* You have Reports or Admin permission
* Try refreshing the page
### Can't Generate AI Insights
**Check:**
1. AI Insights plugin is enabled (Settings → Plugins)
2. API key is configured in plugin settings
3. You have selected at least 2 valuations
4. Check error message for specific issue
### Export PDF Is Blank
**Try:**
1. Ensure popup blocker isn't blocking print dialog
2. Use Chrome or Safari for best results
3. Check browser print permissions
4. Manually use browser Print (Cmd+P / Ctrl+P)
### Export CSV Is Empty
**Check:**
1. At least 2 valuations are selected
2. Browser allows file downloads
3. Try re-exporting
4. Open CSV with Excel or Google Sheets
### Charts Not Loading
**Check:**
1. At least 2 valuations are selected
2. Browser JavaScript is enabled
3. Try refreshing the page
4. Check browser console for errors
### Selection Not Saving
**Check:**
1. Browser cookies/storage is enabled
2. Not in incognito/private mode
3. Try clearing browser cache
4. Re-select valuations and test
## Frequently Asked Questions
### How do I generate valuation reports for stakeholders?
Select at least 2 valuations from the dropdown, review the comparison charts and tables, then click "Export" → "Export PDF" to create a professional branded report for stakeholder presentations. The PDF includes all analytics, charts, and AI insights.
### What formats are available for data export?
Valuation reports support two export formats: PDF for stakeholder presentations and branded reports, and CSV for data analysis in Excel/Google Sheets. PDF exports include charts and formatting, while CSV provides raw data for further analysis.
### Can I customize the PDF report branding?
Yes, PDF exports automatically include your organization logo (uploaded in Settings) and use your brand colors. The report title "Valuation Report" and date range are included, creating professional branded reports for presentations.
### How do AI-powered insights improve reports?
AI Insights analyze your selected valuations to identify trends, patterns, and recommendations automatically. The insights are generated by providers like Groq, Google Gemini, OpenAI, or Anthropic, adding professional analysis to your stakeholder presentations without manual work.
### What's the best way to compare valuations over time?
Select multiple valuations from different time periods, then use the Historical Comparison chart to visualize trends. The chart shows sales, media, and total valuation layers, making it easy to identify growth patterns and present trend analysis to stakeholders.
### How many valuations should I include in a report?
Select at least 2 valuations for comparison (required minimum). For quarterly reviews, select 4 quarters of data. For annual reports, select 12 monthly valuations or 4 quarterly valuations. More data points create richer trend analysis.
### Can I export reports for offline presentations?
Yes, use the "Export PDF" option to download a presentation-ready document that works offline. The PDF preserves all charts, tables, and insights, making it perfect for board meetings, sponsor presentations, or stakeholder reports where internet access isn't available.
### What data is included in CSV exports?
CSV exports include all valuation fields (sales, media, brand metrics) with one row per selected valuation. Player sales appear in a separate section. Raw numerical values are exported (not formatted currencies), making the data ideal for analysis in Excel or data visualization tools.
### How do I create branded reports for sponsors?
Configure your organization logo in Settings, select relevant valuations showing growth, generate AI insights for compelling narrative, then export as PDF. The resulting branded report includes your logo, professional formatting, and comprehensive data perfect for sponsor presentations.
### Can I schedule automatic report generation?
Currently, reports are generated on-demand by selecting valuations and clicking export. For regular reporting cycles, we recommend creating monthly or quarterly valuations, then generating reports as needed for stakeholder presentations. Automated scheduling may be added in future updates.
## Next Steps
Add or remove valuations to adjust comparison
Enable AI Insights plugin for automated analysis
Save as PDF for presentations or CSV for analysis
Discuss trends and insights with your team
Add more data points for richer trend analysis
**Create professional valuation reports for stakeholder presentations** with comprehensive PDF exports, branded reports, and advanced data analytics. Compare multiple valuations side-by-side, generate AI-powered insights, and export presentation-ready documents that demonstrate your sponsorship value with credibility and clarity.
Generate comprehensive reports by comparing multiple valuations side-by-side with trend analysis and AI insights.
## Accessing Reports
Navigate to **Valuations** → **Reports** from the sidebar to access the reports page.
**Permission Required**: You need Reports role or Admin access to view reports.
## Empty State
If you don't have any valuations yet, you'll see:
* **Icon**: Chart graphic
* **Title**: "No Valuations Yet"
* **Message**: "Create your first valuation to get started"
* **Action**: "Create First Valuation" button
## Report Configuration
At the top of the page, configure which valuations to compare.
### Valuation Multi-Select Dropdown
**Label**: "Select valuations..." (or "X valuations selected")
**Features:**
* Multi-select dropdown (select multiple valuations)
* Shows valuation dates as options
* Draft badge for draft valuations
* Checkmark indicator for selected items
* Shows count: "X valuations selected"
* Draft count: "(X Draft)" badge if any drafts are selected
**Auto-Selection**: By default, the newest 2 valuations are automatically selected when you first
open the page.
### Selection Persistence
* Your selection is saved in browser storage
* Returns to your last selection when you revisit the page
* Persists across browser sessions
* Per-organization (different selection for each org)
### Clear Selection Button
**Button**: "Clear" (appears when valuations are selected)
**Action**:
* Removes all selected valuations
* Clears saved selection from storage
* Prevents auto-selection on next visit
Select at least **2 valuations** to generate a report and see comparison charts.
## Report Empty State
**Displays when**: Fewer than 2 valuations are selected
**Message**:
* Icon: Chart graphic
* Title: "Select At Least 2 Valuations"
* Description: "Choose at least two valuations from the dropdown above to generate a report"
## Executive Summary
**Displays when**: 2 or more valuations are selected
Four summary cards showing key metrics from the **newest** selected valuation with trend indicators:
### Total Attention Valuation
**Display**: Final total value (e.g., "€125,000")
**Trend**: Percentage change from oldest to newest (e.g., "+15.2%")
**Color**: Green (increase), Red (decrease), Gray (no change)
### Sales Value
**Display**: Total sales value
**Trend**: Percentage change
**Color**: Green/Red/Gray based on trend
### Media Value
**Display**: Total media value
**Trend**: Percentage change
**Color**: Green/Red/Gray based on trend
### Qualitative Multiplier
**Display**: Brand multiplier (e.g., "1.15x")
**Trend**: Absolute change (e.g., "+0.05")
**Color**: Green/Red/Gray based on trend
Trends compare the **oldest** selected valuation to the **newest** selected valuation, not
sequential changes.
## Historical Comparison Chart
**Title**: "Historical Comparison"
A multi-line area chart showing valuation trends over time.
### Chart Features
**Three Stacked Areas:**
1. **Sales Value (Blue)** - Bottom layer
2. **Media Value (Green)** - Middle layer
3. **Total Attention Valuation (Purple)** - Top layer with brand multiplier
**Additional Elements:**
* **Grid lines** - Help read values
* **Legend** - Shows all three series
* **X-Axis**: Valuation dates (e.g., "Jan 15")
* **Y-Axis**: Currency values
**Interactive**: Hover over any point to see exact values for Total, Sales, Media, and Multiplier
for that date.
### How to Read
* **Upward trend** - Value is increasing
* **Downward trend** - Value is decreasing
* **Flat** - Value is stable
* **Distance between lines** - Shows contribution of sales vs media
## AI Insights
**Plugin Required**: AI Insights require the AI Insights for Reports plugin
(Professional/Enterprise plans). See [AI Insights for Reports](/platform/plugins/ai-insights) for
setup details.
### Enabling AI Insights
**To enable:**
1. Go to **Platform** → **Plugins**
2. Find "AI Insights for Reports" plugin
3. Click "Enable"
4. Configure AI provider (Groq, Google Gemini, OpenAI, Anthropic, or OpenRouter)
5. Enter API key
6. Optionally customize prompt
See [AI Insights Configuration Guide](/platform/plugins/ai-insights#configuration) for detailed setup instructions.
### Generate Insights Button
**Button**: "Generate AI Insights" (blue primary button with sparkles icon)
**Action**:
* Sends selected valuations to AI for analysis
* Generates insights about trends, patterns, and recommendations
* Shows loading spinner while processing
**Displays when**: AI Insights plugin is enabled and valuations are selected
### Insights Display
**Card Title**: "AI Insights" with provider badge (e.g., "Powered by Groq")
**Insight Items**:
* Icon: Sparkles, Bolt, CPU Chip, or Beaker (randomly assigned)
* Title: Bold insight summary
* Description: Detailed insight text
* Multiple insights per report (typically 3-5)
**Empty State** (before generating):
* Icon: Sparkles
* Message: "No insights generated yet"
* Subtitle: "Click 'Generate AI Insights' to analyze your valuations"
**Saved Insights**: Insights are cached in browser storage for your current selection. They'll
reload automatically if you return to the same selection.
### AI Provider Options
**Supported Providers:**
* **Groq** - Fast and cost-effective
* **Google Gemini** - High quality insights
* **OpenAI** - GPT-powered analysis
* **Anthropic** - Claude-powered analysis
**Provider Badge**: Shows which AI generated the insights (e.g., "Powered by Google Gemini")
### Custom Prompts
You can customize the AI prompt in plugin settings to:
* Focus on specific metrics
* Request specific analysis types
* Add context about your organization
* Tailor tone and language
### Common Errors
**"AI Insights plugin is not enabled"**
* Go to Plugins and enable AI Insights
**"AI Insights is not configured"**
* Add your API key in plugin settings
**"Response was truncated due to length"**
* Try selecting fewer valuations
* Reduce custom prompt length
**"AI quota exceeded"**
* Check your API provider plan limits
* Upgrade plan or wait for quota reset
**"AI service is temporarily overloaded"**
* Wait a moment and try again
## Valuation Comparison Table
**Title**: "Valuation Comparison"
A table comparing key metrics across all selected valuations.
### Desktop Table
**Columns:**
* **Metric** - Metric name (left-aligned)
* **\[Date 1]**, **\[Date 2]**, etc. - One column per selected valuation (right-aligned)
* **Change** - Percentage change from oldest to newest (right-aligned)
**Rows:**
1. **Total Value** - Final total valuation
2. **Sales Value** - Total sales revenue
3. **Media Value** - Total media value
4. **Quality Multiplier** - Brand multiplier (shows absolute change, not percentage)
**Colors:**
* Green: Positive change (increase)
* Red: Negative change (decrease)
* Gray: No change
### Mobile View
Instead of table, shows one card per valuation with all metrics:
* Valuation date as card title
* Total Value
* Sales Value
* Media Value
* Quality Multiplier
## Sales Breakdown Table
**Title**: "Sales"
Detailed sales revenue comparison.
### Desktop Table
**Rows:**
* Merchandise Revenue
* Matchday Revenue
**Columns**: Same structure as Valuation Comparison table
**Change Column**: Shows percentage change for each revenue type
### Mobile View
One card per valuation showing:
* Merchandise Revenue
* Matchday Revenue
## Player Sales Table
**Title**: "Player Sales Value"
Individual player transfer breakdown.
### Desktop Table
**Rows**: One row per player sale across all valuations
* Player name in left column
* Sale value only shown for the valuation where player was sold
* Other columns are empty (players are only sold once)
* No change column (not applicable for one-time sales)
**Empty State**: "No player sales recorded in selected valuations"
### Mobile View
One card per player sale showing:
* Player name as card title
* Sale date
* Sale value
**Professional/Enterprise Only**: Player sales tracking requires Professional or Enterprise plan.
## Media Value Breakdown Table
**Title**: "Media Value"
Comparison across all six media channels.
### Desktop Table
**Rows:**
1. TV
2. Web TV
3. PR
4. Digital
5. Social (combined: followers + impressions + engagements)
6. Attendance & Hospitality (combined: attendance + hospitality guests)
**Columns**: Same structure as other tables
**Change Column**: Shows percentage change for each channel
### Mobile View
One card per valuation showing all six channels with values.
### Calculation Notes
* **TV**: Duration \_ Size Multiplier \_ CPM \* Viewers / 1000
* **Web TV**: Views / 1000 \* CPM
* **PR**: Reach / 1000 \* CPM
* **Digital**: Impressions / 1000 \* CPM
* **Social**: Sum of (Followers CPM + Impressions CPM + Engagements CPM)
* **Attendance & Hospitality**: (Attendance / 1000 \_ CPM) + (Guests \_ Value per Guest)
## Brand Value Indicators Table
**Title**: "Brand Value Indicators"
Comparison of all four brand indicators on 1-10 scale.
### Desktop Table
**Rows:**
1. Popularity
2. CSR
3. Culture
4. Fans/Loyalty
**Display**: Values shown as "X.X/10" (e.g., "8.5/10")
**Change Column**: Shows absolute change (e.g., "+0.5"), not percentage
**Colors:**
* Green: Increase
* Red: Decrease
* Gray: No change
### Mobile View
One card per valuation showing all four indicators.
## Export Options
**Button**: "Export" dropdown (top right)
Two export formats available:
### Export PDF
**Action**: Opens browser print dialog
**What's included:**
* Organization logo (if uploaded)
* Report title: "Valuation Report"
* Date range (if 2+ valuations)
* Executive Summary cards
* Historical Comparison chart
* All comparison tables (Valuation, Sales, Player Sales, Media, Brand)
* AI Insights (if generated)
**What's excluded:**
* Navigation elements
* Configuration dropdowns
* Export buttons
* Interactive elements
**Print Settings:**
* **Page size**: A4
* **Margins**: 0.8cm
* **Orientation**: Portrait
* **Colors**: Preserved
**Print-friendly**: The page automatically adjusts for printing. Insights and charts are formatted
for clear printing.
### Export CSV
**Action**: Downloads CSV file
**Filename**: `valuations-report-[first-date]_to_[last-date].csv`
**What's included:**
* All valuation fields for selected valuations
* One row per valuation
* Player sales in separate section
* Raw values (not formatted currencies)
**Use cases:**
* Import into Excel/Google Sheets
* Further analysis with other tools
* Data archival
* Integration with other systems
**2+ Valuations Required**: Export buttons only appear when you have selected at least 2
valuations.
## Common Use Cases
### Quarterly Performance Review
1. Select last 4 quarters' valuations
2. Review Historical Comparison chart for trends
3. Generate AI Insights for recommendations
4. Export PDF for board meeting
5. Use insights to set next quarter goals
### Sponsor Proposal
1. Select valuations from target period
2. Show growth in Executive Summary
3. Highlight positive trends in media channels
4. Export PDF for sponsor presentation
5. Use AI Insights for narrative
### Budget Planning
1. Compare current year vs previous year valuations
2. Analyze which channels drive most value
3. Export CSV for financial modeling
4. Use insights to allocate marketing budget
5. Set targets based on trends
### Performance Benchmarking
1. Select valuations at regular intervals
2. Compare Sales vs Media value trends
3. Check brand indicator consistency
4. Generate AI Insights for patterns
5. Share report with management team
## Permissions
Different permissions show different content:
| Permission | Can Access | Can Generate Insights | Can Export |
| ---------------- | --------------- | ------------------------- | ---------- |
| **Reports Role** | ✅ Yes | ✅ Yes (if plugin enabled) | ✅ Yes |
| **Admin** | ✅ Yes | ✅ Yes (if plugin enabled) | ✅ Yes |
| **Other Roles** | ❌ Access Denied | ❌ No | ❌ No |
**Reports-Only Access**: You can grant team members the Reports role without other valuation
permissions. They can view reports but not create or edit valuations.
## Troubleshooting
### No Valuations Appear in Dropdown
**Check:**
* Valuations exist in your organization
* You have Reports or Admin permission
* Try refreshing the page
### Can't Generate AI Insights
**Check:**
1. AI Insights plugin is enabled (Settings → Plugins)
2. API key is configured in plugin settings
3. You have selected at least 2 valuations
4. Check error message for specific issue
### Export PDF Is Blank
**Try:**
1. Ensure popup blocker isn't blocking print dialog
2. Use Chrome or Safari for best results
3. Check browser print permissions
4. Manually use browser Print (Cmd+P / Ctrl+P)
### Export CSV Is Empty
**Check:**
1. At least 2 valuations are selected
2. Browser allows file downloads
3. Try re-exporting
4. Open CSV with Excel or Google Sheets
### Charts Not Loading
**Check:**
1. At least 2 valuations are selected
2. Browser JavaScript is enabled
3. Try refreshing the page
4. Check browser console for errors
### Selection Not Saving
**Check:**
1. Browser cookies/storage is enabled
2. Not in incognito/private mode
3. Try clearing browser cache
4. Re-select valuations and test
## Frequently Asked Questions
### How do I generate valuation reports for stakeholders?
Select at least 2 valuations from the dropdown, review the comparison charts and tables, then click "Export" → "Export PDF" to create a professional branded report for stakeholder presentations. The PDF includes all analytics, charts, and AI insights.
### What formats are available for data export?
Valuation reports support two export formats: PDF for stakeholder presentations and branded reports, and CSV for data analysis in Excel/Google Sheets. PDF exports include charts and formatting, while CSV provides raw data for further analysis.
### Can I customize the PDF report branding?
Yes, PDF exports automatically include your organization logo (uploaded in Settings) and use your brand colors. The report title "Valuation Report" and date range are included, creating professional branded reports for presentations.
### How do AI-powered insights improve reports?
AI Insights analyze your selected valuations to identify trends, patterns, and recommendations automatically. The insights are generated by providers like Groq, Google Gemini, OpenAI, or Anthropic, adding professional analysis to your stakeholder presentations without manual work.
### What's the best way to compare valuations over time?
Select multiple valuations from different time periods, then use the Historical Comparison chart to visualize trends. The chart shows sales, media, and total valuation layers, making it easy to identify growth patterns and present trend analysis to stakeholders.
### How many valuations should I include in a report?
Select at least 2 valuations for comparison (required minimum). For quarterly reviews, select 4 quarters of data. For annual reports, select 12 monthly valuations or 4 quarterly valuations. More data points create richer trend analysis.
### Can I export reports for offline presentations?
Yes, use the "Export PDF" option to download a presentation-ready document that works offline. The PDF preserves all charts, tables, and insights, making it perfect for board meetings, sponsor presentations, or stakeholder reports where internet access isn't available.
### What data is included in CSV exports?
CSV exports include all valuation fields (sales, media, brand metrics) with one row per selected valuation. Player sales appear in a separate section. Raw numerical values are exported (not formatted currencies), making the data ideal for analysis in Excel or data visualization tools.
### How do I create branded reports for sponsors?
Configure your organization logo in Settings, select relevant valuations showing growth, generate AI insights for compelling narrative, then export as PDF. The resulting branded report includes your logo, professional formatting, and comprehensive data perfect for sponsor presentations.
### Can I schedule automatic report generation?
Currently, reports are generated on-demand by selecting valuations and clicking export. For regular reporting cycles, we recommend creating monthly or quarterly valuations, then generating reports as needed for stakeholder presentations. Automated scheduling may be added in future updates.
## Next Steps
Add or remove valuations to adjust comparison
Enable AI Insights plugin for automated analysis
Save as PDF for presentations or CSV for analysis
Discuss trends and insights with your team
Add more data points for richer trend analysis