> ## Documentation Index
> Fetch the complete documentation index at: https://docs.valiyou.com/llms.txt
> Use this file to discover all available pages before exploring further.
# Details
> View comprehensive valuation details with complete data breakdown, metric analysis, and all sponsorship components. Explore detailed metrics and calculations.
# Valuation Details & Data Breakdown
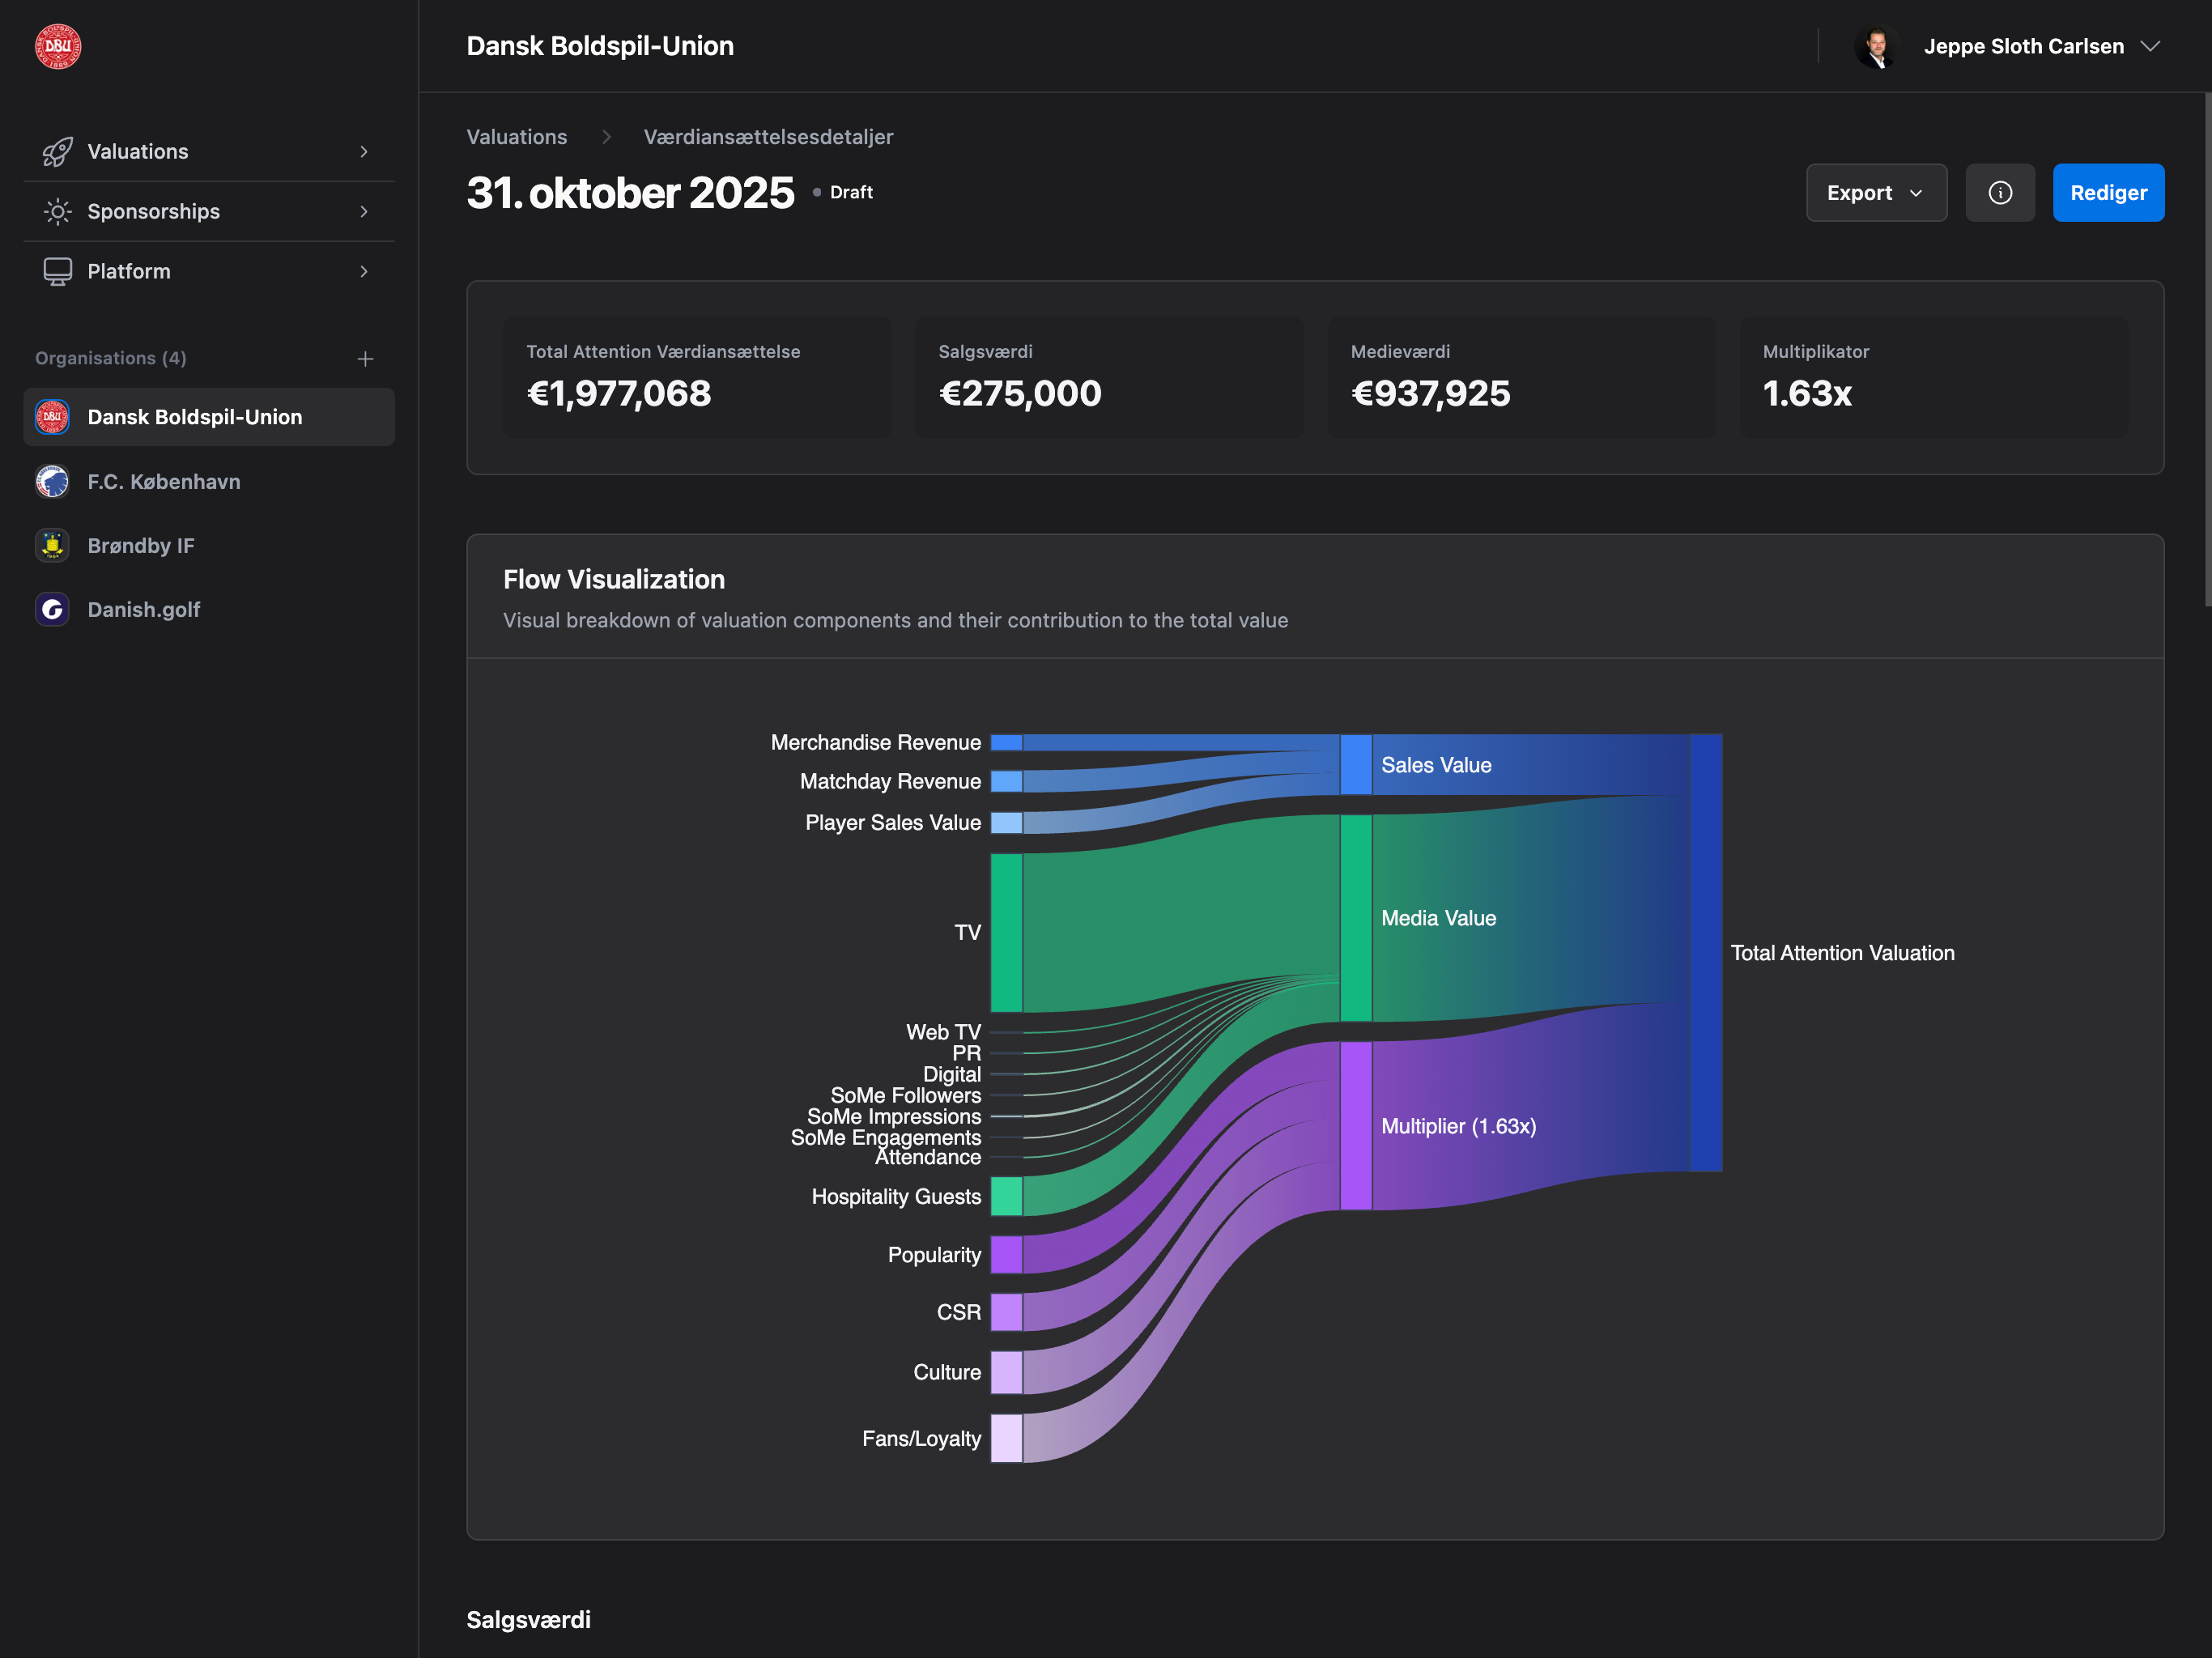 **Access complete valuation breakdowns with detailed metric analysis** across all sponsorship components. View comprehensive data for sales, media, and brand metrics with transparent calculations, visual bars, and CPM breakdowns that provide a comprehensive view of your organization's attention value.
View the complete breakdown of any valuation with detailed metrics, visual bars, and CPM calculations.
## Accessing Valuation Details
Click on any valuation from the **Valuations** list to open its detail page.
**Permission Required**: You need at least one valuation permission (View Sales, View Transfer,
View Marketing, View Brand, or Admin) to view valuation details.
## Page Header
### Mobile Header (Sticky)
Fixed header at the top of mobile screens with:
* **Back button** - Returns to Valuations list (with loading spinner)
* **Export dropdown** - PDF and CSV export options
* **Info button** - Shows approval information
* **Edit button** - Opens edit mode (if you have edit permissions)
### Desktop Header
Breadcrumb navigation:
* **Valuations** - Link back to list
* **Valuation Details** - Current page
**Actions (top right):**
* **Info icon** - Toggle approval information sidebar
* **Export dropdown** - PDF and CSV export
* **Edit button** - Open valuation in edit mode
## Title and Status
**Valuation Date**: Displayed as page title (e.g., "15. januar 2025")
**Status Badge**: Shows Draft (gray) or Approved (green)
The valuation date is the primary identifier - it's the date this valuation represents, not when
it was created.
## Summary Cards
Four metric cards at the top provide key totals:
### Total Attention Valuation
Final calculated value including all components and brand multiplier.
**Display**: Large currency amount (e.g., "€125,000")
### Sales Value
Total sales revenue (merchandise + matchday + player sales).
**Display**: Currency amount
### Media Value
Total media value across all channels (TV, Web TV, PR, Digital, Social, Attendance).
**Display**: Currency amount
### Qualitative Multiplier
Brand multiplier applied to sales and media values.
**Display**: Decimal multiplier (e.g., "1.15x")
These summary cards give you a quick overview before diving into detailed breakdowns below.
## Cash Flow Visualization
**Plugin Required**: This chart requires the Cash Flow Visualization (Sankey) plugin
(Professional/Enterprise plans). See [Cash Flow
Visualization](/platform/plugins/cash-flow-visualization) for setup details.
**Displays when**: Cash Flow Visualization plugin is enabled in Platform → Plugins
An interactive Sankey chart showing value flow from individual components to final total.
### Features
* **Nodes**: Sales, Media, Brand components
* **Flows**: Visual representation of how values combine
* **Interactive**: Hover to see exact values
* **Responsive**: Adapts to screen size
* **Customizable**: Configure chart type, height, color scheme, position, and more
See [Cash Flow Visualization Configuration](/platform/plugins/cash-flow-visualization#configuration) for customization options (chart type, height, color scheme, position, interactivity, animation).
## Sales Value Section
Detailed breakdown of all sales revenue components.
### Merchandise Revenue
**Fields:**
* Label: "Merchandise Revenue"
* Value: Currency amount
* Bar chart: Visual representation relative to total valuation
* Calculation: Direct value from form
### Matchday Revenue
**Fields:**
* Label: "Matchday Revenue"
* Value: Currency amount
* Bar chart: Visual representation
* Calculation: Direct value from form
**Color**: Blue (#3B82F6) for all sales components
Sales values are entered directly - no CPM calculation involved.
## Player Sales Section (Professional/Enterprise)
**Feature Availability**: Player sales tracking requires Professional or Enterprise plan.
Individual player transfers with detailed breakdown.
### Individual Player Sales
For each player sale:
* **Player name** - Name of sold player
* **Sale value** - Transfer fee
* **Bar chart** - Visual representation
* **Color**: Light blue (#60A5FA)
### Total Player Sales Value
Sum of all player transfers:
* **Label**: "Total Player Sales Value"
* **Value**: Sum of all sale values
* **Bar chart**: Combined visual representation
**Empty State**: If no player sales, shows "No player sales data"
## Media Value Section
Comprehensive breakdown across six media channels.
### TV Broadcasting
**Fields:**
* **Duration**: Minutes of TV exposure
* **Size Category**: S (Small ≤1%), M (Medium \~1-5%), L (Large \~5-15%), XL (Extra Large >15%)
* **Viewers**: Total TV viewers count
* **Calculation**: Duration \_ Size Multiplier \_ CPM \* Viewers / 1000
**Size Multipliers:**
* S = 0.4x
* M = 0.7x
* L = 1.0x
* XL = 1.0x
**Example calculation**: `30 minutes * 0.7 (M) * €20 CPM * 50,000 viewers = €21,000`
**CPM = Cost Per Mille**: Cost per thousand impressions. All media values use CPM-based
calculation.
### Web TV
**Fields:**
* **Views**: Total web TV views
* **Calculation**: Views / 1000 \* CPM
**Example**: `10,000 views * €10 CPM = €100`
### PR & Press
**Fields:**
* **Reach**: Total audience reached through PR
* **Calculation**: Reach / 1000 \* CPM
### Digital Advertising
**Fields:**
* **Impressions**: Total digital ad impressions
* **Calculation**: Impressions / 1000 \* CPM
### Social Media
Three separate metrics combined:
**Followers-based:**
* **Social Followers**: Follower count / 1000 \* Followers CPM
**Impressions-based:**
* **Social Impressions**: Impressions / 1000 \* Impressions CPM
**Engagement-based:**
* **Social Engagements**: Engagements / 1000 \* Engagements CPM
Social media value combines three different metrics - use the one(s) most relevant to your
sponsorship value proposition.
### Match & Hospitality
Two components:
**Attendance:**
* **Field**: Total match attendance
* **Calculation**: Attendance / 1000 \* Attendance CPM
**Hospitality:**
* **Field**: Number of hospitality guests
* **Calculation**: Guests \* Value per Guest
**Color**: Green (#10B981) for all media components
### Media Value Features
Every media item displays:
* **Label**: Component name (e.g., "TV Viewers")
* **Value**: Calculated currency amount
* **Bar chart**: Visual representation relative to total
* **Formula**: Shows exact calculation (e.g., "10,000 \* €5.00 CPM")
The formula display helps verify calculations and understand how values were derived.
## Brand Value Indicators Section
Four brand indicators on a 1-10 scale.
### Popularity
**Field**: Brand awareness and recognition (1-10)
**Display**: Value out of 10 (e.g., "8/10")
**Bar chart**: Purple bar showing value relative to max (10)
### CSR (Corporate Social Responsibility)
**Field**: CSR perception (1-10)
**Display**: Value out of 10
### Culture
**Field**: Brand culture and identity strength (1-10)
**Display**: Value out of 10
### Fans/Loyalty
**Field**: Fan and stakeholder loyalty (1-10)
**Display**: Value out of 10
**Color**: Purple (#A855F7) for all brand indicators
Brand indicators multiply the combined sales and media value. Higher scores (7-10) increase total
value, lower scores (1-4) decrease it.
## Mini Bar Charts
Every value component includes a visual bar chart:
### Features
* **Relative scale**: Bar width represents percentage of total valuation
* **Color-coded**: Blue (sales), Light blue (player sales), Green (media), Purple (brand)
* **Responsive**: Adapts to container width
* **Dark mode support**: Adjusts background for readability
### How to Read
* **Longer bar** = Larger contribution to total valuation
* **Shorter bar** = Smaller contribution
* **Empty bar** = Zero value
Mini bars help you quickly identify which components drive the most value in your valuation.
## Approval Information
**Access**: Click Info icon (top right) to toggle
### Desktop Layout
Sticky sidebar on the right side showing:
* **Status badge**: Draft or Approved
* **Status history timeline**: All status changes with dates and users
### Mobile Layout
Slide-in panel from the right showing same information:
* Close with X button or swipe
* Scrollable content
### Status History Timeline
Shows chronological record of:
* **Status changes**: Draft → Approved transitions
* **Who**: User who made the change
* **When**: Date and time of change
* **Visual timeline**: Vertical line connecting events
**Draft Valuations**: Show only creation event **Approved Valuations**: Show creation + approval
event(s)
## Export Options
Dropdown menu with two export formats:
### Export PDF
**Action**: Opens browser print dialog
**Output**: PDF file with print-optimized layout
**What's included:**
* Organization logo (if uploaded)
* Valuation date as title
* All summary metrics
* Complete sales, media, and brand breakdowns
* Mini bar charts (rendered as colored bars)
**What's excluded:**
* Navigation elements
* Buttons and interactive elements
* Approval sidebar (use Info button before printing if needed)
**Print Settings:**
* **Page size**: A4
* **Margins**: 0.8cm
* **Orientation**: Portrait
* **Colors**: Preserved (charts, bars, indicators)
**Print-friendly**: The page automatically adjusts for printing - just click Export PDF and save
or print!
### Export CSV
**Action**: Downloads CSV file
**Filename**: `valuation-YYYY-MM-DD.csv`
**What's included:**
* All valuation fields (excluding player\_sales)
* Player sales in separate section (if any)
* Header row with field names
* Data row with values
**Use cases:**
* Import into Excel/Google Sheets
* Bulk data analysis
* Integration with other systems
* Archival records
CSV export includes **raw values** from the database, not formatted currency amounts.
## Edit Mode
**Button**: "Edit" (top right)
**Access**: Requires edit permissions (Edit Sales/Transfer/Marketing/Brand or Admin)
**Action**: Navigates to edit page with:
* All current values pre-filled
* Same form structure as "Create Valuation"
* Save as Draft or Approve options
**Approved Valuations**: You can edit approved valuations, but changes will reset them to "Draft"
status. Re-approve when ready.
## Common Use Cases
### Reviewing Valuation Accuracy
1. Open valuation from list
2. Check summary cards for overall totals
3. Review each section for data accuracy
4. Verify CPM calculations in formula displays
5. Edit if corrections needed
### Presenting to Sponsors
1. Enable Cash Flow Visualization plugin for visual impact
2. Open valuation detail page
3. Click Export PDF
4. Print or save PDF for proposal
5. Share with sponsor stakeholders
### Analyzing Value Distribution
1. Open valuation
2. Compare mini bar chart widths across components
3. Identify strongest value drivers (sales vs media)
4. Note which media channels contribute most
5. Use insights to focus future efforts
### Tracking Approval History
1. Click Info icon (top right)
2. Review status timeline
3. See who approved and when
4. Verify approval chain for audit purposes
## Permissions
Different permissions show different sections:
| Permission | Can View | Can Export | Can Edit |
| --------------------------------------- | ------------------------------------ | ---------- | ----------------------- |
| **View Sales** | ✅ Sales section only | ✅ Yes | ❌ No |
| **View Transfer** | ✅ Player sales only (Pro/Enterprise) | ✅ Yes | ❌ No |
| **View Marketing** | ✅ Media section only | ✅ Yes | ❌ No |
| **View Brand** | ✅ Brand section only | ✅ Yes | ❌ No |
| **Edit Sales/Transfer/Marketing/Brand** | ✅ Respective sections | ✅ Yes | ✅ Yes (specific fields) |
| **Admin** | ✅ All sections | ✅ Yes | ✅ Yes (all fields) |
**Granular Permissions**: Enterprise plans unlock field-level permissions, allowing precise
control over who can view/edit specific value components.
## Troubleshooting
### Values Look Wrong
**Check:**
1. Verify CPM values in formula displays
2. Common mistake: Entering CPM as cost per impression instead of cost per thousand
3. Check TV size multiplier (S/M/L/XL)
4. Verify all counts (viewers, impressions, reach) are correct
**Fix**: Click Edit button, correct values, save as Draft or Approve
### Export PDF Not Working
**Try:**
1. Ensure popup blocker isn't blocking print dialog
2. Check browser print permissions
3. Use Chrome/Safari for best print results
4. Manually use browser's Print function (Cmd+P / Ctrl+P)
### Export CSV Empty or Corrupted
**Check:**
1. Valuation has saved data (not just loaded)
2. Browser allows file downloads
3. Try opening CSV with different program (Excel, Google Sheets, Notepad)
4. Re-export if file appears corrupted
### Can't Edit Valuation
**Reasons:**
* You don't have edit permissions (only View permissions)
* Contact admin to request Edit Sales/Transfer/Marketing/Brand permissions
* Or request Admin role for full access
### Approval Info Not Showing
**Check:**
* Click Info icon (top right) to toggle visibility
* On mobile: Slide-in panel should appear
* On desktop: Sidebar appears on right side
* If valuation is Draft: Only shows creation event (normal)
## Frequently Asked Questions
### How do I access valuation details and data breakdown?
Click on any valuation from the **Valuations** list to open its detail page. You'll see a comprehensive view with summary cards, detailed breakdowns for sales, media, and brand metrics, and visual bar charts showing each component's contribution.
### What data is included in the metric analysis?
The comprehensive view includes all valuation components: sales value (merchandise, matchday, player sales), media value (TV, Web TV, PR, digital, social, attendance), and brand indicators (popularity, CSR, culture, loyalty). Each metric shows calculations, formulas, and visual bars.
### How do I view detailed calculations for each metric?
Each media component displays its calculation formula. For example, TV shows "Duration \_ Size \_ CPM \* Viewers / 1000" with actual values. This transparent data breakdown helps you verify accuracy and understand how each component contributes to total valuation.
### Can I export valuation details for analysis?
Yes, use "Export CSV" to download raw data for analysis in Excel or other tools. The CSV includes all valuation fields with one row of data, plus a separate section for player sales. For presentations, use "Export PDF" to create a formatted document.
### What do the mini bar charts represent?
Mini bar charts provide visual data breakdown showing each component's contribution relative to total valuation. Longer bars indicate larger contributions. The comprehensive view uses color-coding: blue for sales, green for media, purple for brand indicators.
### How do I understand CPM calculations in details?
Each media component shows its CPM calculation formula. CPM (Cost Per Mille) means cost per 1,000 impressions. The formula "Impressions / 1000 \* CPM" calculates the advertising value. Detailed formulas appear next to each metric for transparent analysis.
### Can I edit valuation details after approval?
Yes, click the "Edit" button (top right) to modify any valuation. However, editing an approved valuation resets it to "Draft" status. Make your changes, then re-approve. This ensures data integrity and maintains an audit trail of changes.
### What's the difference between comprehensive view and summary?
The comprehensive view (this page) shows complete data breakdown with every component, calculation, and visual bar. The summary (dashboard) shows aggregated totals and trends. Use details for deep metric analysis, dashboard for quick overview.
### How do brand indicators affect the comprehensive breakdown?
Brand indicators (popularity, CSR, culture, loyalty) multiply your combined sales and media value. The detail page shows each indicator's score (1-10) and visual bar. Higher scores amplify total valuation, while lower scores reduce it, with full transparency in the data breakdown.
### Can I print valuation details for offline review?
Yes, click "Export PDF" to open the print dialog. The page automatically formats for printing with your organization logo, all metrics, calculations, and visual bars. Save as PDF for offline analysis or stakeholder presentations without internet access.
## Next Steps
Modify values and update your valuation
Use PDF for presentations, CSV for analysis
Return to list and track progress over time
View Dashboard to see trends and patterns
**Access complete valuation breakdowns with detailed metric analysis** across all sponsorship components. View comprehensive data for sales, media, and brand metrics with transparent calculations, visual bars, and CPM breakdowns that provide a comprehensive view of your organization's attention value.
View the complete breakdown of any valuation with detailed metrics, visual bars, and CPM calculations.
## Accessing Valuation Details
Click on any valuation from the **Valuations** list to open its detail page.
**Permission Required**: You need at least one valuation permission (View Sales, View Transfer,
View Marketing, View Brand, or Admin) to view valuation details.
## Page Header
### Mobile Header (Sticky)
Fixed header at the top of mobile screens with:
* **Back button** - Returns to Valuations list (with loading spinner)
* **Export dropdown** - PDF and CSV export options
* **Info button** - Shows approval information
* **Edit button** - Opens edit mode (if you have edit permissions)
### Desktop Header
Breadcrumb navigation:
* **Valuations** - Link back to list
* **Valuation Details** - Current page
**Actions (top right):**
* **Info icon** - Toggle approval information sidebar
* **Export dropdown** - PDF and CSV export
* **Edit button** - Open valuation in edit mode
## Title and Status
**Valuation Date**: Displayed as page title (e.g., "15. januar 2025")
**Status Badge**: Shows Draft (gray) or Approved (green)
The valuation date is the primary identifier - it's the date this valuation represents, not when
it was created.
## Summary Cards
Four metric cards at the top provide key totals:
### Total Attention Valuation
Final calculated value including all components and brand multiplier.
**Display**: Large currency amount (e.g., "€125,000")
### Sales Value
Total sales revenue (merchandise + matchday + player sales).
**Display**: Currency amount
### Media Value
Total media value across all channels (TV, Web TV, PR, Digital, Social, Attendance).
**Display**: Currency amount
### Qualitative Multiplier
Brand multiplier applied to sales and media values.
**Display**: Decimal multiplier (e.g., "1.15x")
These summary cards give you a quick overview before diving into detailed breakdowns below.
## Cash Flow Visualization
**Plugin Required**: This chart requires the Cash Flow Visualization (Sankey) plugin
(Professional/Enterprise plans). See [Cash Flow
Visualization](/platform/plugins/cash-flow-visualization) for setup details.
**Displays when**: Cash Flow Visualization plugin is enabled in Platform → Plugins
An interactive Sankey chart showing value flow from individual components to final total.
### Features
* **Nodes**: Sales, Media, Brand components
* **Flows**: Visual representation of how values combine
* **Interactive**: Hover to see exact values
* **Responsive**: Adapts to screen size
* **Customizable**: Configure chart type, height, color scheme, position, and more
See [Cash Flow Visualization Configuration](/platform/plugins/cash-flow-visualization#configuration) for customization options (chart type, height, color scheme, position, interactivity, animation).
## Sales Value Section
Detailed breakdown of all sales revenue components.
### Merchandise Revenue
**Fields:**
* Label: "Merchandise Revenue"
* Value: Currency amount
* Bar chart: Visual representation relative to total valuation
* Calculation: Direct value from form
### Matchday Revenue
**Fields:**
* Label: "Matchday Revenue"
* Value: Currency amount
* Bar chart: Visual representation
* Calculation: Direct value from form
**Color**: Blue (#3B82F6) for all sales components
Sales values are entered directly - no CPM calculation involved.
## Player Sales Section (Professional/Enterprise)
**Feature Availability**: Player sales tracking requires Professional or Enterprise plan.
Individual player transfers with detailed breakdown.
### Individual Player Sales
For each player sale:
* **Player name** - Name of sold player
* **Sale value** - Transfer fee
* **Bar chart** - Visual representation
* **Color**: Light blue (#60A5FA)
### Total Player Sales Value
Sum of all player transfers:
* **Label**: "Total Player Sales Value"
* **Value**: Sum of all sale values
* **Bar chart**: Combined visual representation
**Empty State**: If no player sales, shows "No player sales data"
## Media Value Section
Comprehensive breakdown across six media channels.
### TV Broadcasting
**Fields:**
* **Duration**: Minutes of TV exposure
* **Size Category**: S (Small ≤1%), M (Medium \~1-5%), L (Large \~5-15%), XL (Extra Large >15%)
* **Viewers**: Total TV viewers count
* **Calculation**: Duration \_ Size Multiplier \_ CPM \* Viewers / 1000
**Size Multipliers:**
* S = 0.4x
* M = 0.7x
* L = 1.0x
* XL = 1.0x
**Example calculation**: `30 minutes * 0.7 (M) * €20 CPM * 50,000 viewers = €21,000`
**CPM = Cost Per Mille**: Cost per thousand impressions. All media values use CPM-based
calculation.
### Web TV
**Fields:**
* **Views**: Total web TV views
* **Calculation**: Views / 1000 \* CPM
**Example**: `10,000 views * €10 CPM = €100`
### PR & Press
**Fields:**
* **Reach**: Total audience reached through PR
* **Calculation**: Reach / 1000 \* CPM
### Digital Advertising
**Fields:**
* **Impressions**: Total digital ad impressions
* **Calculation**: Impressions / 1000 \* CPM
### Social Media
Three separate metrics combined:
**Followers-based:**
* **Social Followers**: Follower count / 1000 \* Followers CPM
**Impressions-based:**
* **Social Impressions**: Impressions / 1000 \* Impressions CPM
**Engagement-based:**
* **Social Engagements**: Engagements / 1000 \* Engagements CPM
Social media value combines three different metrics - use the one(s) most relevant to your
sponsorship value proposition.
### Match & Hospitality
Two components:
**Attendance:**
* **Field**: Total match attendance
* **Calculation**: Attendance / 1000 \* Attendance CPM
**Hospitality:**
* **Field**: Number of hospitality guests
* **Calculation**: Guests \* Value per Guest
**Color**: Green (#10B981) for all media components
### Media Value Features
Every media item displays:
* **Label**: Component name (e.g., "TV Viewers")
* **Value**: Calculated currency amount
* **Bar chart**: Visual representation relative to total
* **Formula**: Shows exact calculation (e.g., "10,000 \* €5.00 CPM")
The formula display helps verify calculations and understand how values were derived.
## Brand Value Indicators Section
Four brand indicators on a 1-10 scale.
### Popularity
**Field**: Brand awareness and recognition (1-10)
**Display**: Value out of 10 (e.g., "8/10")
**Bar chart**: Purple bar showing value relative to max (10)
### CSR (Corporate Social Responsibility)
**Field**: CSR perception (1-10)
**Display**: Value out of 10
### Culture
**Field**: Brand culture and identity strength (1-10)
**Display**: Value out of 10
### Fans/Loyalty
**Field**: Fan and stakeholder loyalty (1-10)
**Display**: Value out of 10
**Color**: Purple (#A855F7) for all brand indicators
Brand indicators multiply the combined sales and media value. Higher scores (7-10) increase total
value, lower scores (1-4) decrease it.
## Mini Bar Charts
Every value component includes a visual bar chart:
### Features
* **Relative scale**: Bar width represents percentage of total valuation
* **Color-coded**: Blue (sales), Light blue (player sales), Green (media), Purple (brand)
* **Responsive**: Adapts to container width
* **Dark mode support**: Adjusts background for readability
### How to Read
* **Longer bar** = Larger contribution to total valuation
* **Shorter bar** = Smaller contribution
* **Empty bar** = Zero value
Mini bars help you quickly identify which components drive the most value in your valuation.
## Approval Information
**Access**: Click Info icon (top right) to toggle
### Desktop Layout
Sticky sidebar on the right side showing:
* **Status badge**: Draft or Approved
* **Status history timeline**: All status changes with dates and users
### Mobile Layout
Slide-in panel from the right showing same information:
* Close with X button or swipe
* Scrollable content
### Status History Timeline
Shows chronological record of:
* **Status changes**: Draft → Approved transitions
* **Who**: User who made the change
* **When**: Date and time of change
* **Visual timeline**: Vertical line connecting events
**Draft Valuations**: Show only creation event **Approved Valuations**: Show creation + approval
event(s)
## Export Options
Dropdown menu with two export formats:
### Export PDF
**Action**: Opens browser print dialog
**Output**: PDF file with print-optimized layout
**What's included:**
* Organization logo (if uploaded)
* Valuation date as title
* All summary metrics
* Complete sales, media, and brand breakdowns
* Mini bar charts (rendered as colored bars)
**What's excluded:**
* Navigation elements
* Buttons and interactive elements
* Approval sidebar (use Info button before printing if needed)
**Print Settings:**
* **Page size**: A4
* **Margins**: 0.8cm
* **Orientation**: Portrait
* **Colors**: Preserved (charts, bars, indicators)
**Print-friendly**: The page automatically adjusts for printing - just click Export PDF and save
or print!
### Export CSV
**Action**: Downloads CSV file
**Filename**: `valuation-YYYY-MM-DD.csv`
**What's included:**
* All valuation fields (excluding player\_sales)
* Player sales in separate section (if any)
* Header row with field names
* Data row with values
**Use cases:**
* Import into Excel/Google Sheets
* Bulk data analysis
* Integration with other systems
* Archival records
CSV export includes **raw values** from the database, not formatted currency amounts.
## Edit Mode
**Button**: "Edit" (top right)
**Access**: Requires edit permissions (Edit Sales/Transfer/Marketing/Brand or Admin)
**Action**: Navigates to edit page with:
* All current values pre-filled
* Same form structure as "Create Valuation"
* Save as Draft or Approve options
**Approved Valuations**: You can edit approved valuations, but changes will reset them to "Draft"
status. Re-approve when ready.
## Common Use Cases
### Reviewing Valuation Accuracy
1. Open valuation from list
2. Check summary cards for overall totals
3. Review each section for data accuracy
4. Verify CPM calculations in formula displays
5. Edit if corrections needed
### Presenting to Sponsors
1. Enable Cash Flow Visualization plugin for visual impact
2. Open valuation detail page
3. Click Export PDF
4. Print or save PDF for proposal
5. Share with sponsor stakeholders
### Analyzing Value Distribution
1. Open valuation
2. Compare mini bar chart widths across components
3. Identify strongest value drivers (sales vs media)
4. Note which media channels contribute most
5. Use insights to focus future efforts
### Tracking Approval History
1. Click Info icon (top right)
2. Review status timeline
3. See who approved and when
4. Verify approval chain for audit purposes
## Permissions
Different permissions show different sections:
| Permission | Can View | Can Export | Can Edit |
| --------------------------------------- | ------------------------------------ | ---------- | ----------------------- |
| **View Sales** | ✅ Sales section only | ✅ Yes | ❌ No |
| **View Transfer** | ✅ Player sales only (Pro/Enterprise) | ✅ Yes | ❌ No |
| **View Marketing** | ✅ Media section only | ✅ Yes | ❌ No |
| **View Brand** | ✅ Brand section only | ✅ Yes | ❌ No |
| **Edit Sales/Transfer/Marketing/Brand** | ✅ Respective sections | ✅ Yes | ✅ Yes (specific fields) |
| **Admin** | ✅ All sections | ✅ Yes | ✅ Yes (all fields) |
**Granular Permissions**: Enterprise plans unlock field-level permissions, allowing precise
control over who can view/edit specific value components.
## Troubleshooting
### Values Look Wrong
**Check:**
1. Verify CPM values in formula displays
2. Common mistake: Entering CPM as cost per impression instead of cost per thousand
3. Check TV size multiplier (S/M/L/XL)
4. Verify all counts (viewers, impressions, reach) are correct
**Fix**: Click Edit button, correct values, save as Draft or Approve
### Export PDF Not Working
**Try:**
1. Ensure popup blocker isn't blocking print dialog
2. Check browser print permissions
3. Use Chrome/Safari for best print results
4. Manually use browser's Print function (Cmd+P / Ctrl+P)
### Export CSV Empty or Corrupted
**Check:**
1. Valuation has saved data (not just loaded)
2. Browser allows file downloads
3. Try opening CSV with different program (Excel, Google Sheets, Notepad)
4. Re-export if file appears corrupted
### Can't Edit Valuation
**Reasons:**
* You don't have edit permissions (only View permissions)
* Contact admin to request Edit Sales/Transfer/Marketing/Brand permissions
* Or request Admin role for full access
### Approval Info Not Showing
**Check:**
* Click Info icon (top right) to toggle visibility
* On mobile: Slide-in panel should appear
* On desktop: Sidebar appears on right side
* If valuation is Draft: Only shows creation event (normal)
## Frequently Asked Questions
### How do I access valuation details and data breakdown?
Click on any valuation from the **Valuations** list to open its detail page. You'll see a comprehensive view with summary cards, detailed breakdowns for sales, media, and brand metrics, and visual bar charts showing each component's contribution.
### What data is included in the metric analysis?
The comprehensive view includes all valuation components: sales value (merchandise, matchday, player sales), media value (TV, Web TV, PR, digital, social, attendance), and brand indicators (popularity, CSR, culture, loyalty). Each metric shows calculations, formulas, and visual bars.
### How do I view detailed calculations for each metric?
Each media component displays its calculation formula. For example, TV shows "Duration \_ Size \_ CPM \* Viewers / 1000" with actual values. This transparent data breakdown helps you verify accuracy and understand how each component contributes to total valuation.
### Can I export valuation details for analysis?
Yes, use "Export CSV" to download raw data for analysis in Excel or other tools. The CSV includes all valuation fields with one row of data, plus a separate section for player sales. For presentations, use "Export PDF" to create a formatted document.
### What do the mini bar charts represent?
Mini bar charts provide visual data breakdown showing each component's contribution relative to total valuation. Longer bars indicate larger contributions. The comprehensive view uses color-coding: blue for sales, green for media, purple for brand indicators.
### How do I understand CPM calculations in details?
Each media component shows its CPM calculation formula. CPM (Cost Per Mille) means cost per 1,000 impressions. The formula "Impressions / 1000 \* CPM" calculates the advertising value. Detailed formulas appear next to each metric for transparent analysis.
### Can I edit valuation details after approval?
Yes, click the "Edit" button (top right) to modify any valuation. However, editing an approved valuation resets it to "Draft" status. Make your changes, then re-approve. This ensures data integrity and maintains an audit trail of changes.
### What's the difference between comprehensive view and summary?
The comprehensive view (this page) shows complete data breakdown with every component, calculation, and visual bar. The summary (dashboard) shows aggregated totals and trends. Use details for deep metric analysis, dashboard for quick overview.
### How do brand indicators affect the comprehensive breakdown?
Brand indicators (popularity, CSR, culture, loyalty) multiply your combined sales and media value. The detail page shows each indicator's score (1-10) and visual bar. Higher scores amplify total valuation, while lower scores reduce it, with full transparency in the data breakdown.
### Can I print valuation details for offline review?
Yes, click "Export PDF" to open the print dialog. The page automatically formats for printing with your organization logo, all metrics, calculations, and visual bars. Save as PDF for offline analysis or stakeholder presentations without internet access.
## Next Steps
Modify values and update your valuation
Use PDF for presentations, CSV for analysis
Return to list and track progress over time
View Dashboard to see trends and patterns