> ## Documentation Index
> Fetch the complete documentation index at: https://docs.valiyou.com/llms.txt
> Use this file to discover all available pages before exploring further.
# Valuations
> Browse all valuations with historical data tracking, comparison view, and trend analysis. Filter, compare, and analyze sponsorship value changes over time.
# Valuations List & Historical Data
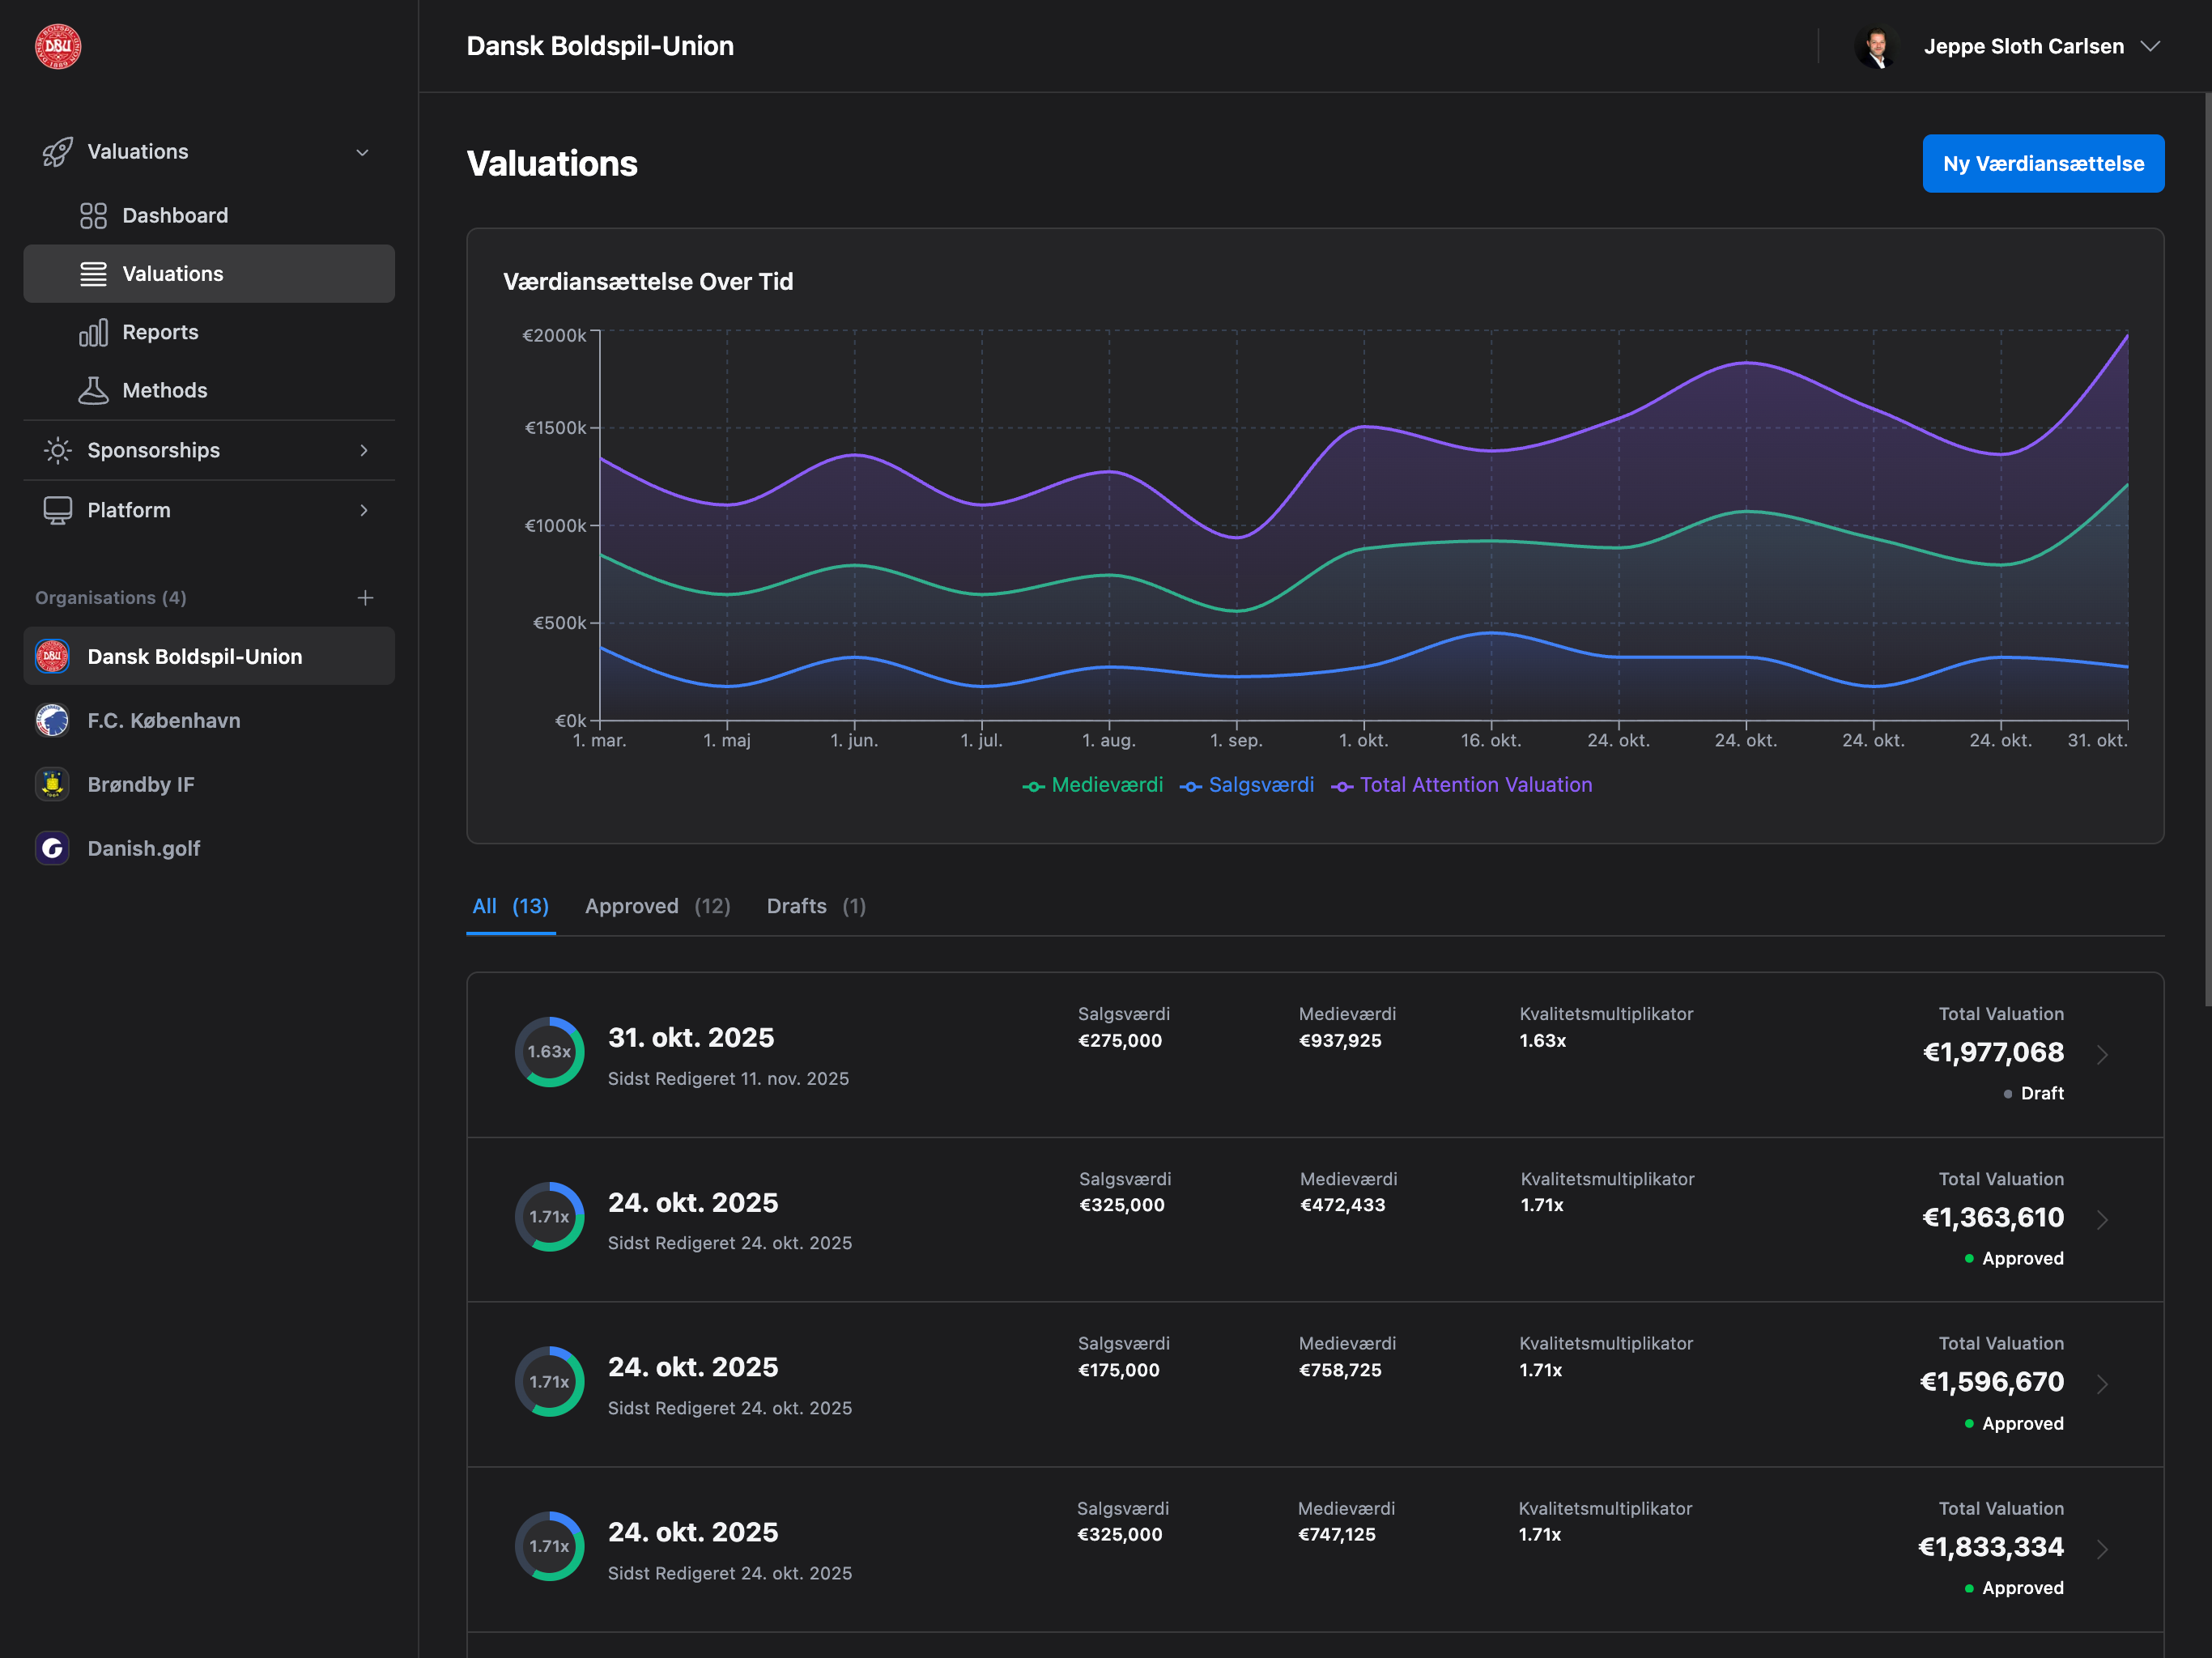 **Track sponsorship value changes over time with comprehensive historical data** and powerful comparison tools. View all valuations in a sortable list, analyze trends with time-series data visualization, and compare performance across periods to identify growth patterns and opportunities.
Browse all valuations in your organization, filter by status, and track value changes over time.
## Accessing Valuations
Navigate to **Valuations** → **Valuations** from the sidebar to access your full valuation list.
**Permission Required**: You need at least one valuation permission (View Sales, View Transfer,
View Marketing, View Brand, or Admin) to access this page.
## Empty State
If you don't have any valuations yet, you'll see:
* **Icon**: Document graphic
* **Title**: "No Valuations Yet"
* **Message**: "Create your first valuation to get started"
* **Action**: "Create First Valuation" button
Click "Create First Valuation" to start tracking your sponsorship value!
## Page Header
The page header shows:
* **Title**: "Valuations"
* **Create Button**: "Create Valuation" button (top right)
### Create Valuation Button
* **Normal state**: Blue primary button with "Create Valuation" text
* **Loading state**: Shows spinner while navigating
* **Limit reached**: Shows "Limit reached" text and is disabled
**Plan Limits**: Your plan has a maximum number of valuations per year. If you've reached your
limit, you'll need to upgrade your plan or contact billing.
## Valuation Over Time Chart
**Displays when**: You have 2 or more valuations
A stacked area chart showing valuation trends across time.
### Chart Components
**Three Stacked Areas:**
1. **Sales Value (Blue)** - Bottom layer showing sales revenue
2. **Media Value (Green)** - Middle layer showing media value
3. **Total Attention Valuation (Purple)** - Top layer showing final total with brand multiplier
### How to Read It
* **X-Axis**: Valuation dates (e.g., "Jan 15", "Feb 20")
* **Y-Axis**: Currency values (e.g., "€10k", "€20k")
* **Stacked areas**: Show how sales and media contribute to total
* **Purple line**: Total valuation including brand multiplier
**Interactive Tooltip**: Hover over any point to see exact values for that date: - Total Attention
Valuation - Sales Value - Media Value - Brand Multiplier (e.g., "1.15x")
### Chart Features
* **Legend**: Shows all three data series with color indicators
* **Grid lines**: Help read exact values
* **Responsive**: Adapts to screen size
* **Date format**: Short date format (day + month abbreviation)
* **Value format**: Abbreviated for readability (€10k instead of €10,000)
The chart displays valuations in chronological order based on the `valuation_date` field, not the
creation date.
## Filter Tabs
Three tabs to filter valuations by status:
### All Tab
Shows all valuations regardless of status.
* **Badge count**: Total number of valuations
* **Active indicator**: Blue underline when selected
### Approved Tab
Shows only approved valuations.
* **Badge count**: Number of approved valuations
* **Appears in**: Dashboard charts, reports, proposals
* **Status badge**: Green "Approved" chip
### Drafts Tab
Shows only draft valuations.
* **Badge count**: Number of draft valuations
* **Can be edited**: Drafts can still be modified
* **Status badge**: Gray "Draft" chip
Filtering resets pagination to page 1 automatically.
## Valuation List
A card-based list showing all valuations with key metrics.
### List Item Layout
Each valuation displays:
**Left Section:**
* **Circle indicator** - Visual breakdown of value composition
* **Valuation date** - Primary date for this valuation (e.g., "15. jan 2025")
* **Last edited date** - When the valuation was last updated
**Middle Section (Desktop only):**
Three columns showing:
1. **Sales Value** - Total sales revenue
2. **Media Value** - Total media value
3. **Qualitative Multiplier** - Brand multiplier (e.g., "1.15x")
**Right Section:**
* **Total Valuation** - Final calculated value
* **Status badge** - Draft or Approved
* **Chevron icon** - Indicates clickable item
The middle section (3 columns) is hidden on mobile and tablet to save space. All data is still
available in the detail view.
### Circle Indicator
The circle on the left visually represents value composition using a conic gradient:
**Colors:**
* **Blue segment** - Sales value percentage
* **Green segment** - Media value percentage
* **Gray segment** - Remaining percentage (brand multiplier impact)
**Center number**: Shows brand multiplier (e.g., "1.15x")
The circle gives a quick visual breakdown of where your value comes from. Larger blue = more
sales-driven, larger green = more media-driven.
### Loading State
When clicking a valuation to open it:
* **Circle indicator** - Shows spinner instead of gradient
* **List item** - Becomes semi-transparent (60% opacity)
* **Interaction** - Disabled while loading
## Pagination
**Displays when**: You have more than 10 valuations
* **Items per page**: 10 valuations
* **Navigation**: Previous/Next buttons + page numbers
* **Page info**: Shows "X-Y of Z items" (e.g., "1-10 of 25 items")
* **Auto-scroll**: Scrolls to top when changing pages
Pagination is applied **after** filtering. Each filter tab (All, Approved, Drafts) has its own
pagination.
## Interactions
### Click on Valuation
Click anywhere on a valuation list item to:
1. Show loading spinner in circle
2. Navigate to valuation detail page
3. View complete breakdown
The entire row is clickable - no need to aim for a specific button!
### Hover Effects
* **List items**: Background color changes on hover (light gray)
* **Chart points**: Tooltip appears showing exact values
* **Buttons**: Color and border changes indicate interactivity
## Plan Limits
### Valuation Limit Modal
If you've reached your plan's valuation limit, clicking "Create Valuation" shows:
**Modal Content:**
* **Title**: "Valuation Limit Reached"
* **Current usage**: e.g., "You've created 50 valuations this year"
* **Plan limit**: e.g., "Your Professional plan includes 50 valuations/year"
* **Action**: "Upgrade Plan" button (if you have billing access)
**Admin/Finance Only**: Only admins and finance managers can access billing to upgrade the plan.
Other users will see the modal but can't upgrade.
### Plan Tiers
Valuation limits by plan:
* **Starter**: Limited valuations per year
* **Professional**: More valuations per year
* **Enterprise**: Unlimited valuations
Valuation limits reset annually based on your subscription start date.
## Empty Filtered List
If a filter shows no results:
**Example**: Clicking "Drafts" when you have no draft valuations
* No empty state message (intentional)
* Shows empty list container
* Filter tabs remain functional
If you see an empty list, try switching to the "All" tab to see all your valuations.
## Common Use Cases
### Tracking Progress
1. View **Valuation Over Time Chart** to see growth trends
2. Compare sales vs media contribution over time
3. Identify seasonal patterns or anomalies
### Managing Drafts
1. Click **Drafts** tab to see unfinished valuations
2. Click on a draft to continue editing
3. Approve when ready to include in reports
### Finding Specific Valuations
1. Use **All** tab to see complete history
2. Scroll through list or use pagination
3. Look at dates to identify the valuation you need
4. Click to open detail view
### Bulk Review
1. View **Approved** tab to see finalized valuations
2. Check total valuations in the list
3. Identify outliers or unexpected values
4. Click to investigate details
## Permissions
Different permissions affect what you see:
| Permission | Can View List | Can Create | Can Edit |
| --------------------------------------- | ------------- | ---------- | ---------------------------- |
| **View Sales/Transfer/Marketing/Brand** | ✅ Yes | ❌ No | ❌ No |
| **Edit Sales/Transfer/Marketing/Brand** | ✅ Yes | ✅ Yes | ✅ Yes (specific fields only) |
| **Admin** | ✅ Yes | ✅ Yes | ✅ Yes (all fields) |
| **No valuation permissions** | ❌ Redirected | ❌ No | ❌ No |
Granular permissions (Edit Sales, Edit Transfer, Edit Marketing, Edit Brand) are available on
Enterprise plans.
## Troubleshooting
### "Access Denied" Page
If you see "Access Denied":
* You don't have any valuation permissions
* Contact your organization admin to request access
* They can grant you View or Edit permissions
### Create Button Disabled
If "Create Valuation" button shows "Limit reached":
* Your organization has reached the plan limit
* Admins/finance managers can upgrade the plan
* Or wait until next year when the limit resets
### Chart Not Showing
If you don't see the Valuation Over Time chart:
* You need at least **2 approved valuations** to show trends
* Create and approve more valuations to unlock the chart
### Values Look Wrong
If valuation values seem incorrect:
* Click on the valuation to view detailed breakdown
* Check if all fields were properly filled
* Verify CPM values are correct (common mistake: entering per-impression instead of per-thousand)
* Check brand multiplier in Settings → Brand Values
## Frequently Asked Questions
### How do I view historical data for valuations?
Navigate to **Valuations** → **Valuations** to see your complete historical data. The list shows all valuations sorted by date. For trend analysis, the "Valuation Over Time Chart" appears when you have 2+ valuations, visualizing time-series data across sales, media, and total valuation.
### What's the best way to use the comparison view?
Use the filter tabs (All, Approved, Drafts) to organize your comparison view. The "Valuation Over Time Chart" provides visual comparison of trends. Click on individual valuations to compare detailed breakdowns side-by-side. For advanced comparison, use the Reports page to analyze multiple valuations simultaneously.
### How does trend analysis work in the valuations list?
Trend analysis appears in the time-series chart showing three stacked layers: sales value (blue), media value (green), and total valuation (purple). Hover over any point for exact values. The chart reveals growth patterns, seasonal variations, and value composition changes over your historical data.
### Can I filter valuations to see specific time periods?
Use the filter tabs to view All, Approved, or Draft valuations. The list displays historical data chronologically. For specific date range analysis, use the Reports page where you can select multiple valuations from any time period for detailed comparison and trend analysis.
### How do I track changes in valuation over time?
The Valuation Over Time Chart provides time-series data visualization showing how your total valuation, sales, and media values change across dates. Each list item shows the last edited date for tracking recent changes. Compare historical data points by clicking individual valuations for detailed breakdowns.
### What does the circle indicator represent?
The circle provides visual comparison of value composition using color-coded segments: blue for sales value percentage, green for media value percentage, and gray for brand multiplier impact. The center number shows your brand multiplier (e.g., "1.15x"). This quick visualization helps compare value drivers across your historical data.
### How many valuations should I create for good trend analysis?
Create valuations regularly (monthly or quarterly) to build rich time-series data. You need at least 2 valuations to see the trend chart. For quarterly reviews, create 4+ valuations. For annual analysis, 12 monthly valuations provide comprehensive historical data for accurate trend analysis and comparison.
### Can I compare draft and approved valuations?
Yes, use the "All" tab to see both draft and approved valuations in your historical data. Draft valuations appear with gray badges, approved with green badges. Note that only approved valuations appear in dashboard charts and reports, ensuring comparison accuracy for stakeholder presentations.
### How do I export historical data for analysis?
Click on individual valuations and use "Export CSV" for data export. For comparing multiple valuations, use the Reports page to select specific historical data points and export them together as a comprehensive report with trend analysis and comparison charts.
### What happens when I reach my valuation limit?
When your plan's annual limit is reached, the "Create Valuation" button becomes disabled. Admins can upgrade the plan for more valuations. Your existing historical data remains accessible for viewing, comparison, and trend analysis. Limits reset annually based on your subscription date.
## Next Steps
Learn how to view complete valuation breakdown
Add another data point to track progress
Use dashboard and charts to identify patterns
Advanced analytics and reporting
**Track sponsorship value changes over time with comprehensive historical data** and powerful comparison tools. View all valuations in a sortable list, analyze trends with time-series data visualization, and compare performance across periods to identify growth patterns and opportunities.
Browse all valuations in your organization, filter by status, and track value changes over time.
## Accessing Valuations
Navigate to **Valuations** → **Valuations** from the sidebar to access your full valuation list.
**Permission Required**: You need at least one valuation permission (View Sales, View Transfer,
View Marketing, View Brand, or Admin) to access this page.
## Empty State
If you don't have any valuations yet, you'll see:
* **Icon**: Document graphic
* **Title**: "No Valuations Yet"
* **Message**: "Create your first valuation to get started"
* **Action**: "Create First Valuation" button
Click "Create First Valuation" to start tracking your sponsorship value!
## Page Header
The page header shows:
* **Title**: "Valuations"
* **Create Button**: "Create Valuation" button (top right)
### Create Valuation Button
* **Normal state**: Blue primary button with "Create Valuation" text
* **Loading state**: Shows spinner while navigating
* **Limit reached**: Shows "Limit reached" text and is disabled
**Plan Limits**: Your plan has a maximum number of valuations per year. If you've reached your
limit, you'll need to upgrade your plan or contact billing.
## Valuation Over Time Chart
**Displays when**: You have 2 or more valuations
A stacked area chart showing valuation trends across time.
### Chart Components
**Three Stacked Areas:**
1. **Sales Value (Blue)** - Bottom layer showing sales revenue
2. **Media Value (Green)** - Middle layer showing media value
3. **Total Attention Valuation (Purple)** - Top layer showing final total with brand multiplier
### How to Read It
* **X-Axis**: Valuation dates (e.g., "Jan 15", "Feb 20")
* **Y-Axis**: Currency values (e.g., "€10k", "€20k")
* **Stacked areas**: Show how sales and media contribute to total
* **Purple line**: Total valuation including brand multiplier
**Interactive Tooltip**: Hover over any point to see exact values for that date: - Total Attention
Valuation - Sales Value - Media Value - Brand Multiplier (e.g., "1.15x")
### Chart Features
* **Legend**: Shows all three data series with color indicators
* **Grid lines**: Help read exact values
* **Responsive**: Adapts to screen size
* **Date format**: Short date format (day + month abbreviation)
* **Value format**: Abbreviated for readability (€10k instead of €10,000)
The chart displays valuations in chronological order based on the `valuation_date` field, not the
creation date.
## Filter Tabs
Three tabs to filter valuations by status:
### All Tab
Shows all valuations regardless of status.
* **Badge count**: Total number of valuations
* **Active indicator**: Blue underline when selected
### Approved Tab
Shows only approved valuations.
* **Badge count**: Number of approved valuations
* **Appears in**: Dashboard charts, reports, proposals
* **Status badge**: Green "Approved" chip
### Drafts Tab
Shows only draft valuations.
* **Badge count**: Number of draft valuations
* **Can be edited**: Drafts can still be modified
* **Status badge**: Gray "Draft" chip
Filtering resets pagination to page 1 automatically.
## Valuation List
A card-based list showing all valuations with key metrics.
### List Item Layout
Each valuation displays:
**Left Section:**
* **Circle indicator** - Visual breakdown of value composition
* **Valuation date** - Primary date for this valuation (e.g., "15. jan 2025")
* **Last edited date** - When the valuation was last updated
**Middle Section (Desktop only):**
Three columns showing:
1. **Sales Value** - Total sales revenue
2. **Media Value** - Total media value
3. **Qualitative Multiplier** - Brand multiplier (e.g., "1.15x")
**Right Section:**
* **Total Valuation** - Final calculated value
* **Status badge** - Draft or Approved
* **Chevron icon** - Indicates clickable item
The middle section (3 columns) is hidden on mobile and tablet to save space. All data is still
available in the detail view.
### Circle Indicator
The circle on the left visually represents value composition using a conic gradient:
**Colors:**
* **Blue segment** - Sales value percentage
* **Green segment** - Media value percentage
* **Gray segment** - Remaining percentage (brand multiplier impact)
**Center number**: Shows brand multiplier (e.g., "1.15x")
The circle gives a quick visual breakdown of where your value comes from. Larger blue = more
sales-driven, larger green = more media-driven.
### Loading State
When clicking a valuation to open it:
* **Circle indicator** - Shows spinner instead of gradient
* **List item** - Becomes semi-transparent (60% opacity)
* **Interaction** - Disabled while loading
## Pagination
**Displays when**: You have more than 10 valuations
* **Items per page**: 10 valuations
* **Navigation**: Previous/Next buttons + page numbers
* **Page info**: Shows "X-Y of Z items" (e.g., "1-10 of 25 items")
* **Auto-scroll**: Scrolls to top when changing pages
Pagination is applied **after** filtering. Each filter tab (All, Approved, Drafts) has its own
pagination.
## Interactions
### Click on Valuation
Click anywhere on a valuation list item to:
1. Show loading spinner in circle
2. Navigate to valuation detail page
3. View complete breakdown
The entire row is clickable - no need to aim for a specific button!
### Hover Effects
* **List items**: Background color changes on hover (light gray)
* **Chart points**: Tooltip appears showing exact values
* **Buttons**: Color and border changes indicate interactivity
## Plan Limits
### Valuation Limit Modal
If you've reached your plan's valuation limit, clicking "Create Valuation" shows:
**Modal Content:**
* **Title**: "Valuation Limit Reached"
* **Current usage**: e.g., "You've created 50 valuations this year"
* **Plan limit**: e.g., "Your Professional plan includes 50 valuations/year"
* **Action**: "Upgrade Plan" button (if you have billing access)
**Admin/Finance Only**: Only admins and finance managers can access billing to upgrade the plan.
Other users will see the modal but can't upgrade.
### Plan Tiers
Valuation limits by plan:
* **Starter**: Limited valuations per year
* **Professional**: More valuations per year
* **Enterprise**: Unlimited valuations
Valuation limits reset annually based on your subscription start date.
## Empty Filtered List
If a filter shows no results:
**Example**: Clicking "Drafts" when you have no draft valuations
* No empty state message (intentional)
* Shows empty list container
* Filter tabs remain functional
If you see an empty list, try switching to the "All" tab to see all your valuations.
## Common Use Cases
### Tracking Progress
1. View **Valuation Over Time Chart** to see growth trends
2. Compare sales vs media contribution over time
3. Identify seasonal patterns or anomalies
### Managing Drafts
1. Click **Drafts** tab to see unfinished valuations
2. Click on a draft to continue editing
3. Approve when ready to include in reports
### Finding Specific Valuations
1. Use **All** tab to see complete history
2. Scroll through list or use pagination
3. Look at dates to identify the valuation you need
4. Click to open detail view
### Bulk Review
1. View **Approved** tab to see finalized valuations
2. Check total valuations in the list
3. Identify outliers or unexpected values
4. Click to investigate details
## Permissions
Different permissions affect what you see:
| Permission | Can View List | Can Create | Can Edit |
| --------------------------------------- | ------------- | ---------- | ---------------------------- |
| **View Sales/Transfer/Marketing/Brand** | ✅ Yes | ❌ No | ❌ No |
| **Edit Sales/Transfer/Marketing/Brand** | ✅ Yes | ✅ Yes | ✅ Yes (specific fields only) |
| **Admin** | ✅ Yes | ✅ Yes | ✅ Yes (all fields) |
| **No valuation permissions** | ❌ Redirected | ❌ No | ❌ No |
Granular permissions (Edit Sales, Edit Transfer, Edit Marketing, Edit Brand) are available on
Enterprise plans.
## Troubleshooting
### "Access Denied" Page
If you see "Access Denied":
* You don't have any valuation permissions
* Contact your organization admin to request access
* They can grant you View or Edit permissions
### Create Button Disabled
If "Create Valuation" button shows "Limit reached":
* Your organization has reached the plan limit
* Admins/finance managers can upgrade the plan
* Or wait until next year when the limit resets
### Chart Not Showing
If you don't see the Valuation Over Time chart:
* You need at least **2 approved valuations** to show trends
* Create and approve more valuations to unlock the chart
### Values Look Wrong
If valuation values seem incorrect:
* Click on the valuation to view detailed breakdown
* Check if all fields were properly filled
* Verify CPM values are correct (common mistake: entering per-impression instead of per-thousand)
* Check brand multiplier in Settings → Brand Values
## Frequently Asked Questions
### How do I view historical data for valuations?
Navigate to **Valuations** → **Valuations** to see your complete historical data. The list shows all valuations sorted by date. For trend analysis, the "Valuation Over Time Chart" appears when you have 2+ valuations, visualizing time-series data across sales, media, and total valuation.
### What's the best way to use the comparison view?
Use the filter tabs (All, Approved, Drafts) to organize your comparison view. The "Valuation Over Time Chart" provides visual comparison of trends. Click on individual valuations to compare detailed breakdowns side-by-side. For advanced comparison, use the Reports page to analyze multiple valuations simultaneously.
### How does trend analysis work in the valuations list?
Trend analysis appears in the time-series chart showing three stacked layers: sales value (blue), media value (green), and total valuation (purple). Hover over any point for exact values. The chart reveals growth patterns, seasonal variations, and value composition changes over your historical data.
### Can I filter valuations to see specific time periods?
Use the filter tabs to view All, Approved, or Draft valuations. The list displays historical data chronologically. For specific date range analysis, use the Reports page where you can select multiple valuations from any time period for detailed comparison and trend analysis.
### How do I track changes in valuation over time?
The Valuation Over Time Chart provides time-series data visualization showing how your total valuation, sales, and media values change across dates. Each list item shows the last edited date for tracking recent changes. Compare historical data points by clicking individual valuations for detailed breakdowns.
### What does the circle indicator represent?
The circle provides visual comparison of value composition using color-coded segments: blue for sales value percentage, green for media value percentage, and gray for brand multiplier impact. The center number shows your brand multiplier (e.g., "1.15x"). This quick visualization helps compare value drivers across your historical data.
### How many valuations should I create for good trend analysis?
Create valuations regularly (monthly or quarterly) to build rich time-series data. You need at least 2 valuations to see the trend chart. For quarterly reviews, create 4+ valuations. For annual analysis, 12 monthly valuations provide comprehensive historical data for accurate trend analysis and comparison.
### Can I compare draft and approved valuations?
Yes, use the "All" tab to see both draft and approved valuations in your historical data. Draft valuations appear with gray badges, approved with green badges. Note that only approved valuations appear in dashboard charts and reports, ensuring comparison accuracy for stakeholder presentations.
### How do I export historical data for analysis?
Click on individual valuations and use "Export CSV" for data export. For comparing multiple valuations, use the Reports page to select specific historical data points and export them together as a comprehensive report with trend analysis and comparison charts.
### What happens when I reach my valuation limit?
When your plan's annual limit is reached, the "Create Valuation" button becomes disabled. Admins can upgrade the plan for more valuations. Your existing historical data remains accessible for viewing, comparison, and trend analysis. Limits reset annually based on your subscription date.
## Next Steps
Learn how to view complete valuation breakdown
Add another data point to track progress
Use dashboard and charts to identify patterns
Advanced analytics and reporting