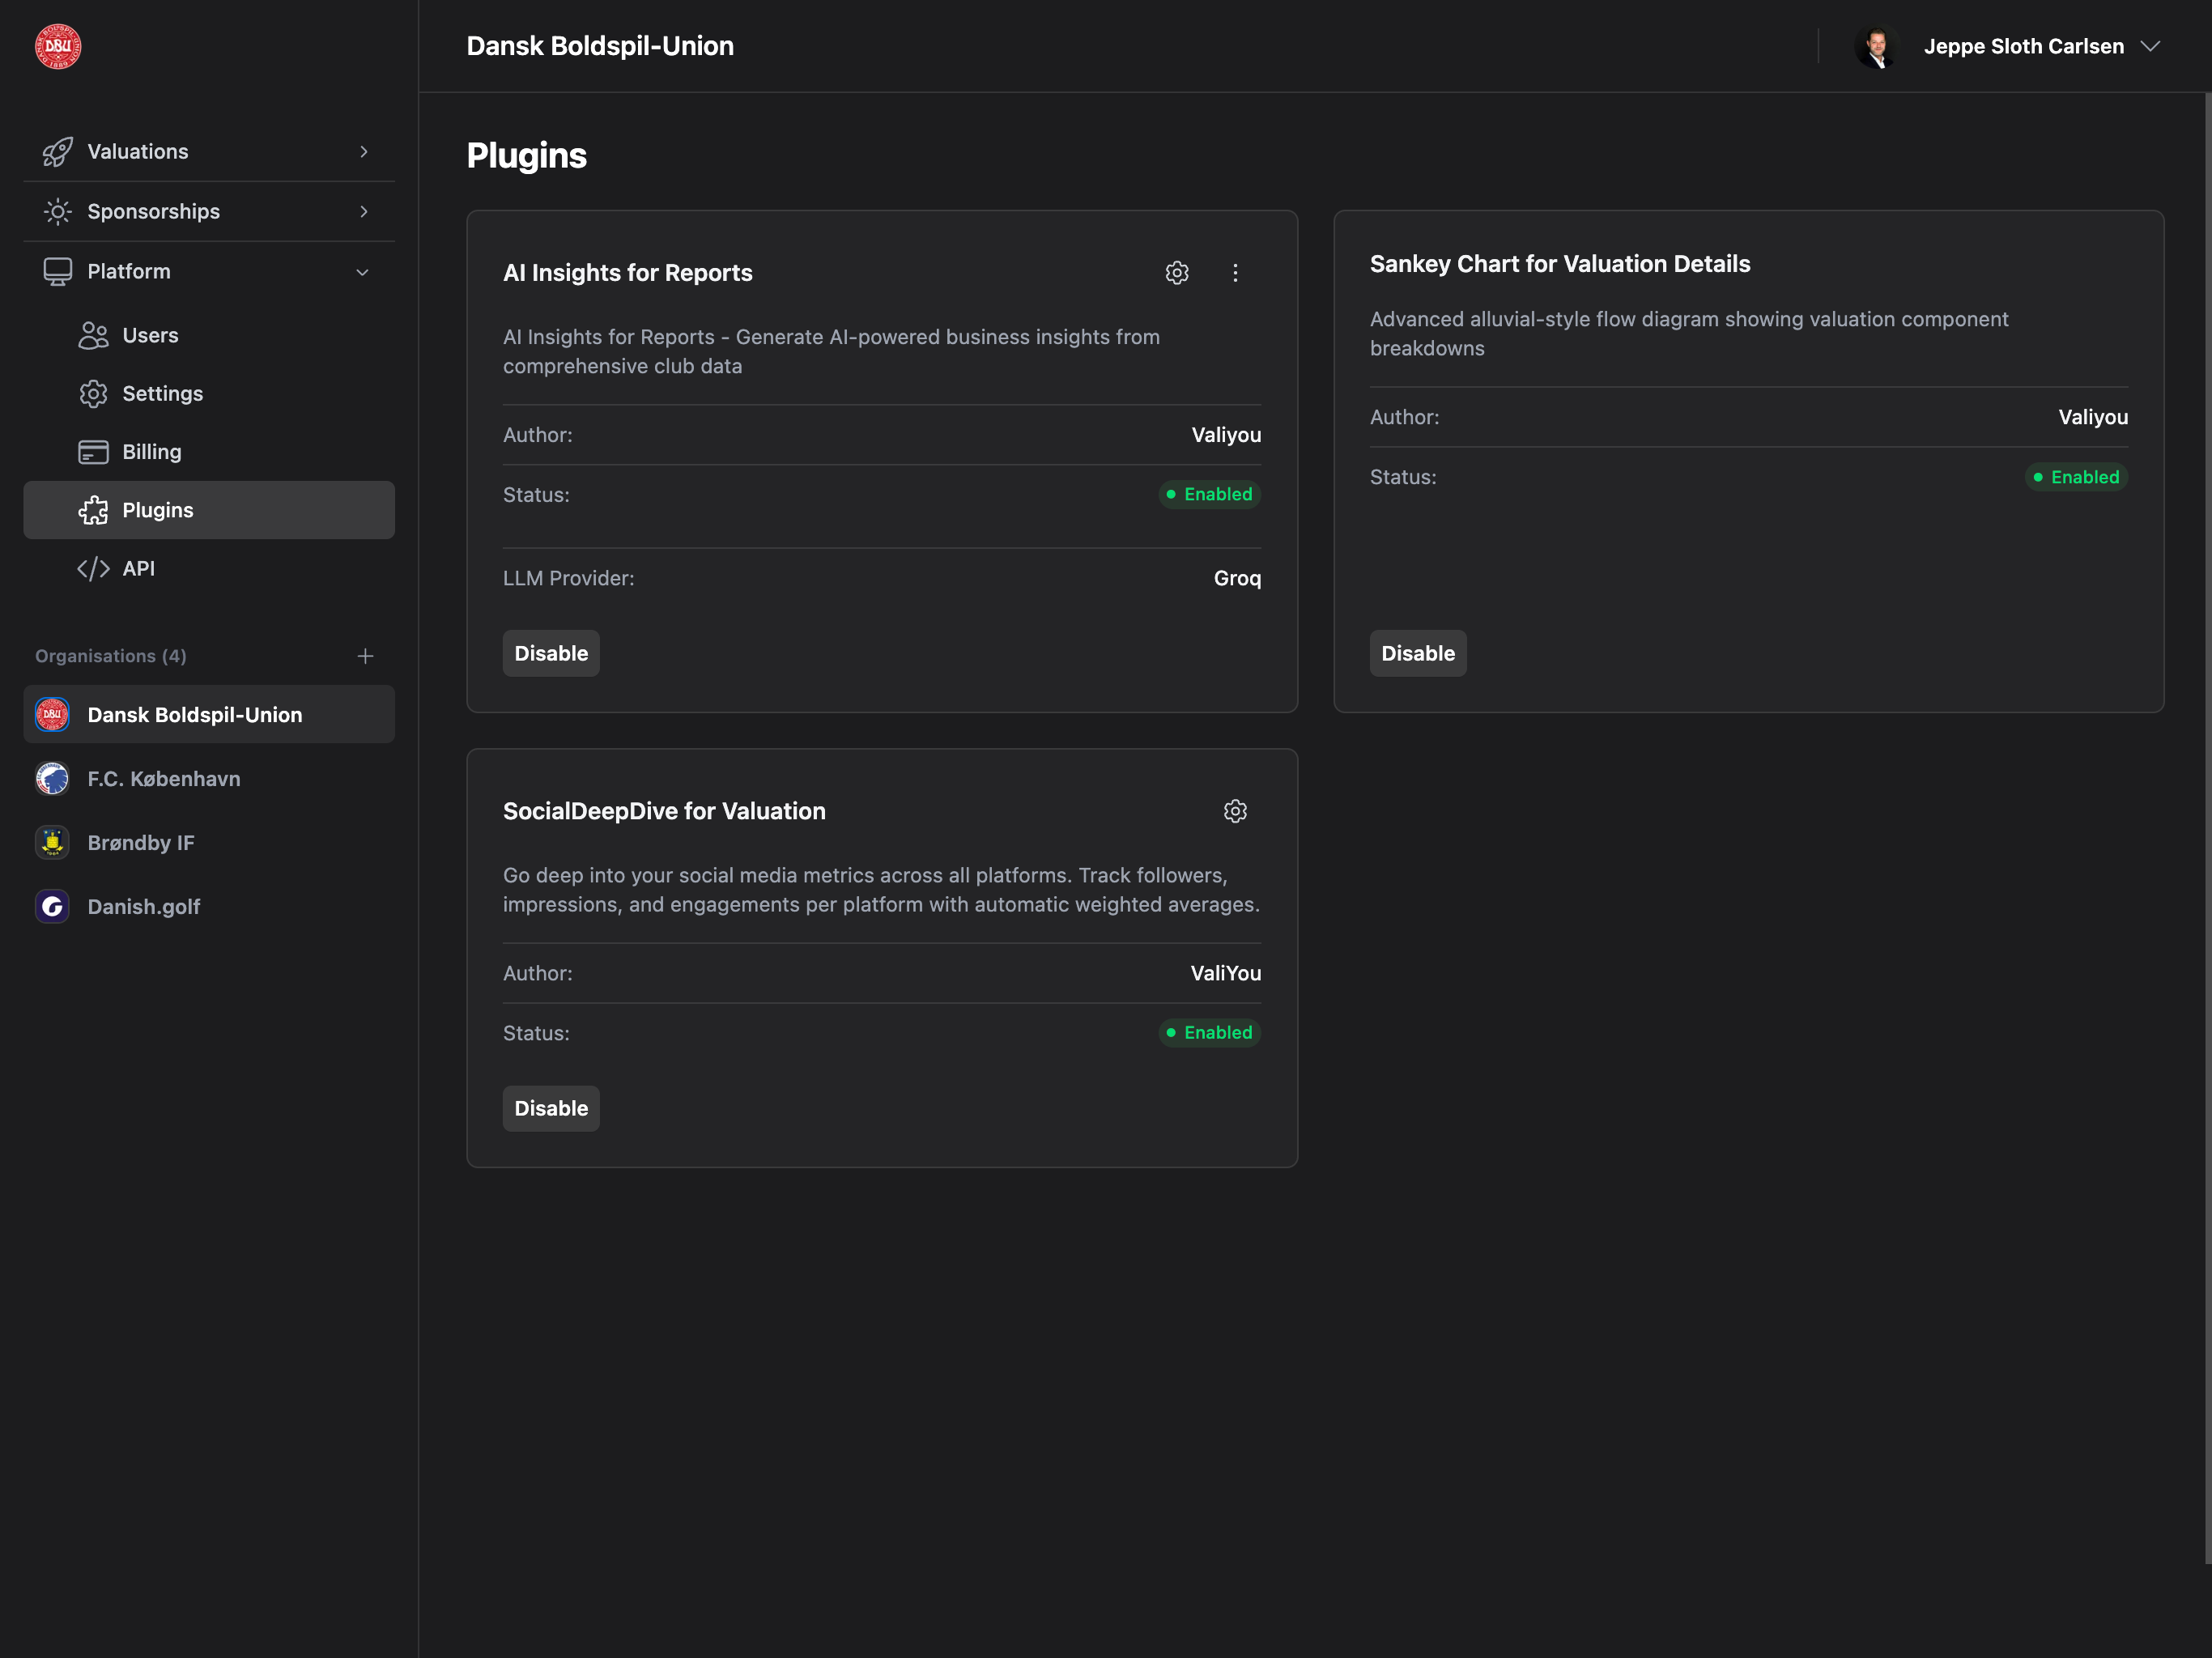
Accessing Plugins
Navigate to Platform → Plugins from the sidebar to manage plugins.Permission Required: Plugins permission or Admin access required to enable/disable and configure plugins.
Available Plugins
Universal CSV Importer

Plan Required: Professional or Enterprise plan
Permission Required: Sponsors permission (write access)
- Salesforce - Auto-detects and maps Salesforce CSV exports
- HubSpot - Auto-detects and maps HubSpot CSV exports
- Pipedrive - Auto-detects and maps Pipedrive CSV exports
- Microsoft Dynamics - Auto-detects and maps Dynamics CSV exports
- Zoho CRM - Auto-detects and maps Zoho CRM exports
- Excel/Manual CSV - Custom CSV files with manual field mapping
- Other - Generic CSV import
- Multi-file upload (sponsors + contacts)
- Intelligent auto-field mapping
- Confidence level indicators (High, Medium, Low)
- Relationship linking (contacts → sponsors)
- Duplicate detection
- Validation and error handling
- Preview before import
- Import results summary
- Migrate from existing CRM to Valiyou
- Import large datasets quickly
- Auto-link contacts to sponsors
- Reduce manual data entry
AI Insights for Reports
Plan Required: Professional or Enterprise plan
Permission Required: Reports permission + Plugins permission
- Groq (Free tier available) - Recommended for speed
- Google Gemini (Free tier available) - Good balance
- OpenRouter (Free tier available) - Multi-model access
- OpenAI (Paid) - GPT-4, GPT-3.5
- Anthropic (Paid) - Claude models
- Select LLM Provider (dropdown with icons and “Free” badges)
- Select Model (each provider has multiple models)
- Enter API Key for selected provider
- Save Configuration
- Automated insights from valuation data
- Trend analysis across multiple valuations
- Recommendations and observations
- Natural language explanations of patterns
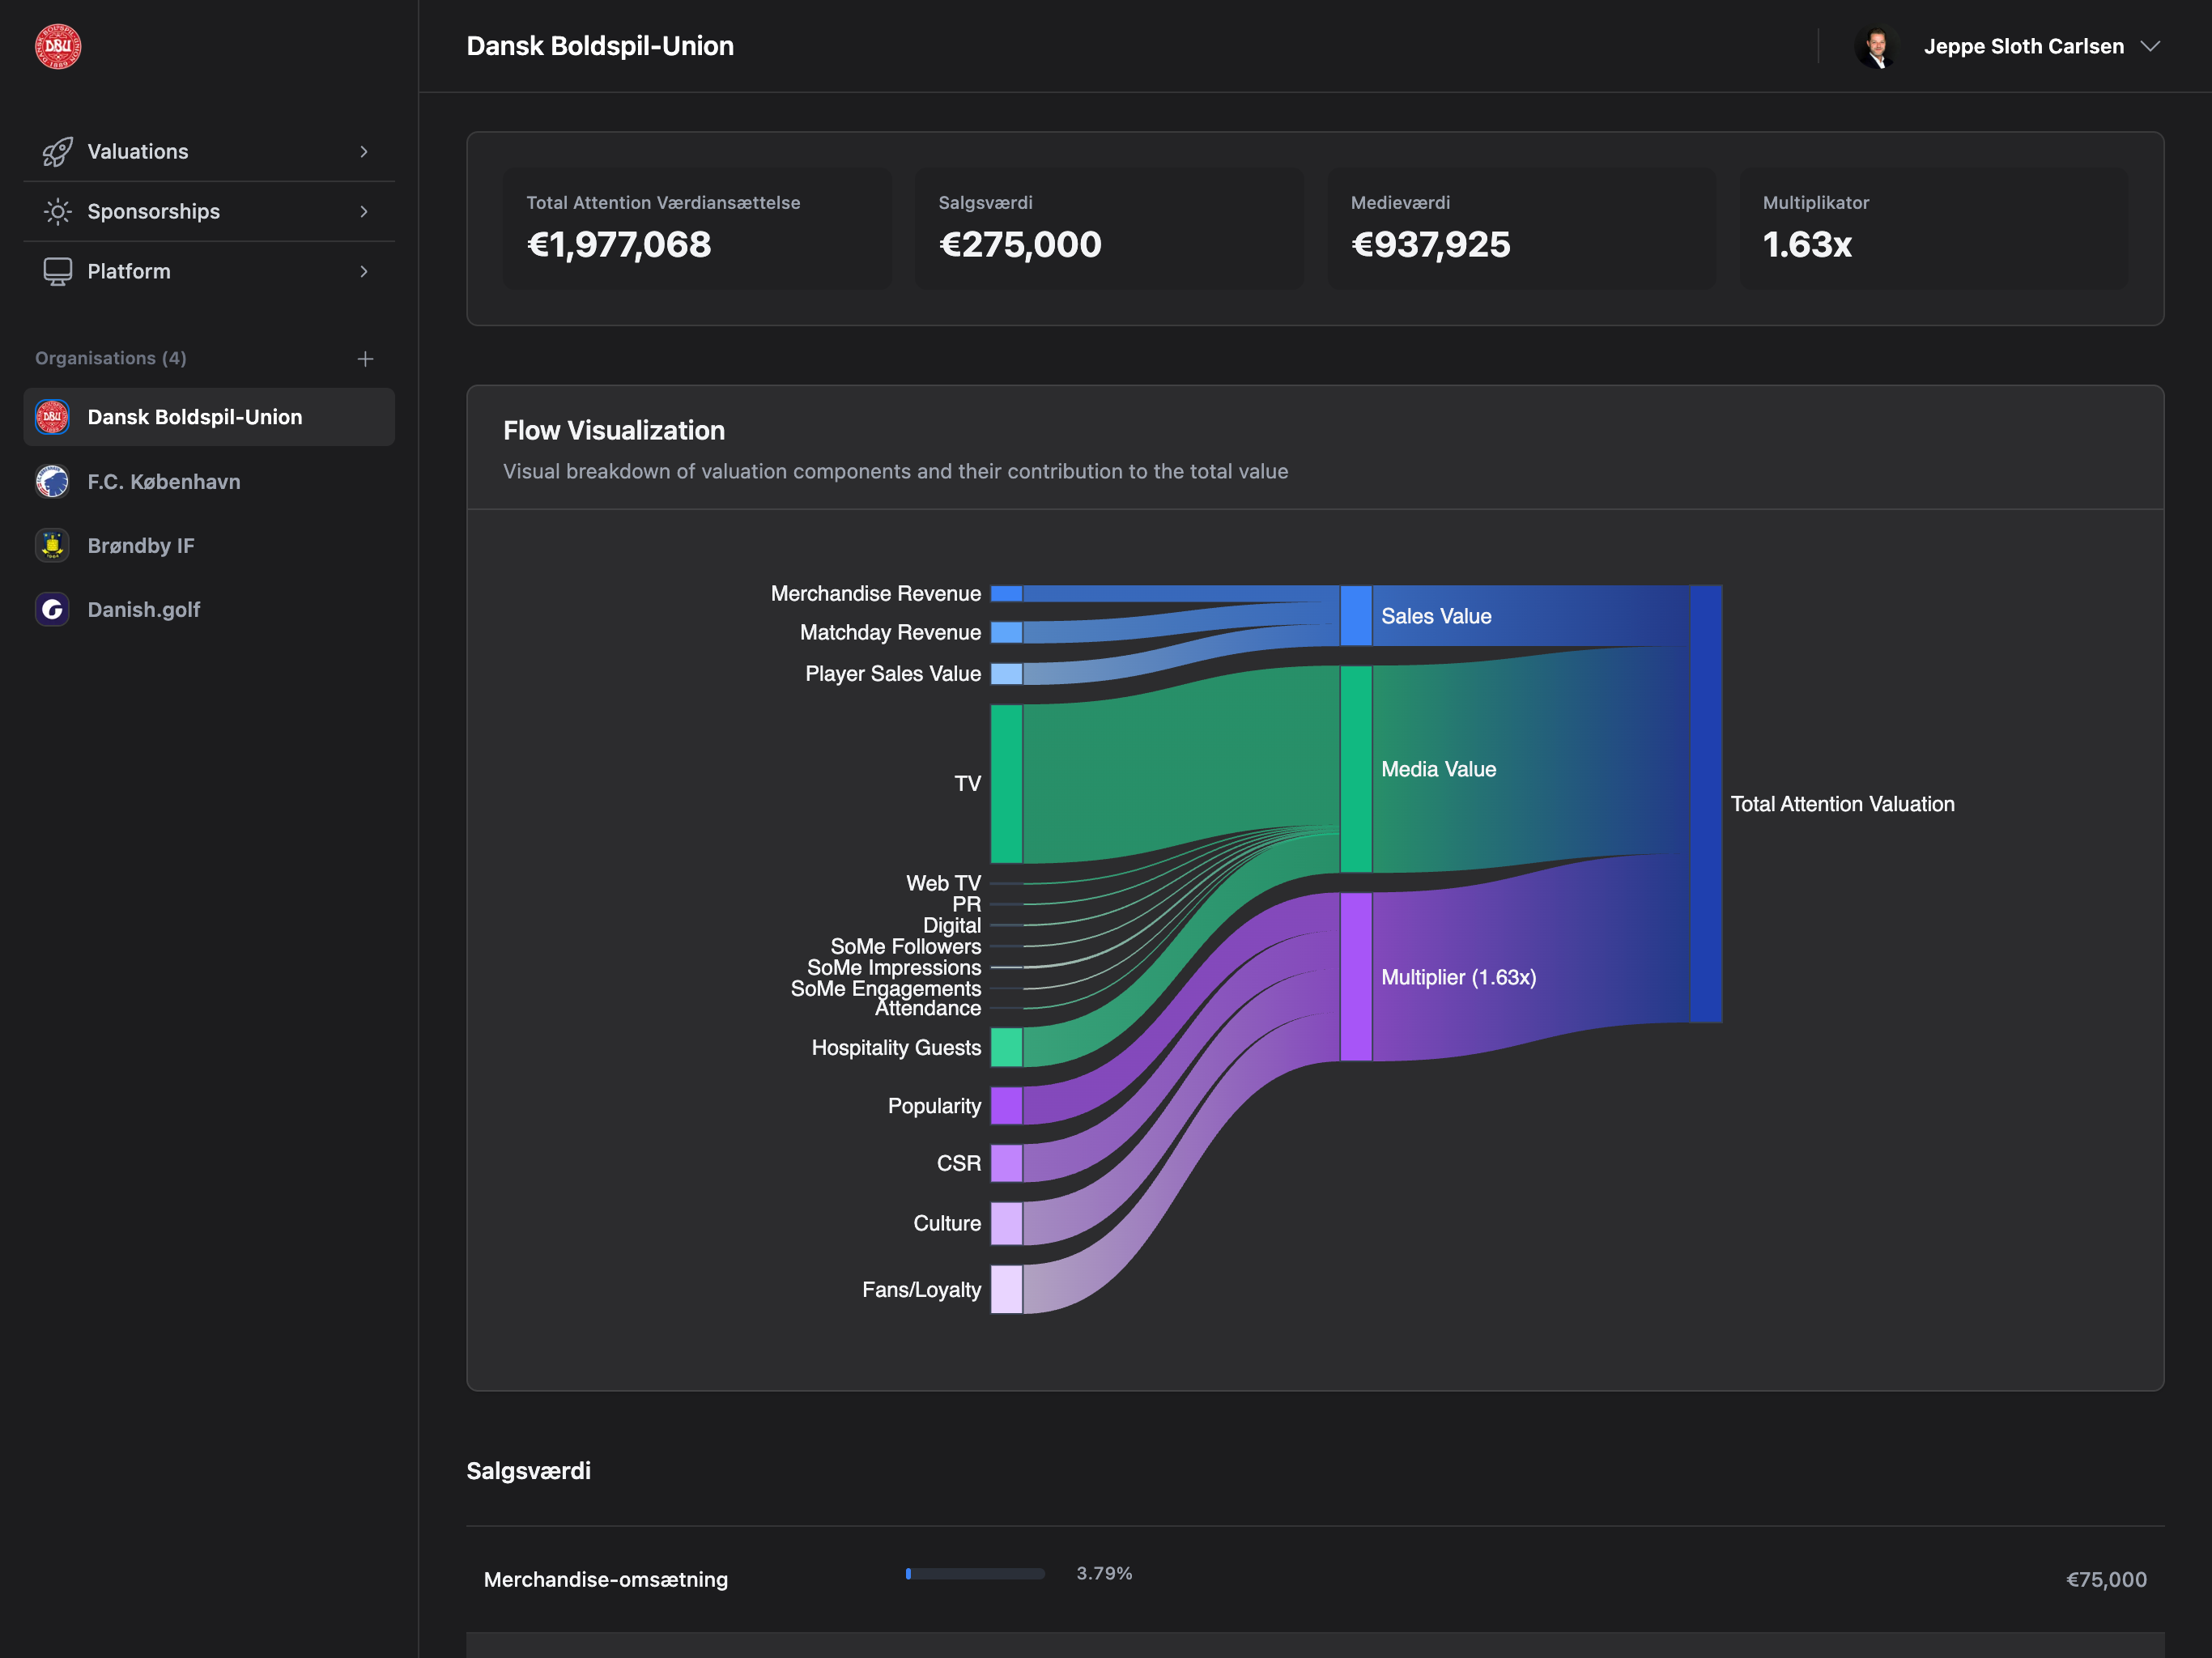
Cash Flow Visualization (Sankey)
Plan Required: Professional or Enterprise plan
Permission Required: Automatically available with plan
- Sankey (Alluvial Flow) - Recommended, shows revenue flow
- Waterfall - Traditional waterfall chart
- Custom - Custom visualization
- Chart Type: Sankey, Waterfall, or Custom
- Chart Height: Pixels (default: 600px)
- Color Scheme: Default (multi-color), Blue, Green, Purple, Custom
- Chart Position: Before Sales, After Sales, Top of Page, Bottom of Page
- Show Legend: Toggle legend visibility
- Show Tooltips: Toggle interactive tooltips
- Show Labels: Toggle data labels
- Enable Interactivity: Toggle click/hover interactions
- Animation Duration: Milliseconds (default: 300ms)
- Visual revenue flow representation
- Interactive data exploration
- Customizable appearance
- Professional presentation
SocialDeepDive
Plan Required: Professional or Enterprise plan (Feature in development)
Permission Required: Plugins permission
- YouTube
- TikTok
- Tumblr
- Slack
- Vimeo
- Behance
- Yelp
- Flickr
- Enable/disable specific platforms
- Platform-specific settings (separate modal)
- Detailed social media insights
- Cross-platform comparison
- Engagement metrics
- Audience analytics
Coming Soon: SocialDeepDive is currently in development. Enable the plugin to get early access when available.
Plugin Management
Enabling a Plugin
Process:- Navigate to Platform → Plugins
- Find the plugin card
- Click “Enable” button (primary blue)
- Plugin status changes to “Enabled” (green badge)
- Configure button (gear icon) appears in header
- Plugin included in your plan (Professional/Enterprise)
- Required permissions (Reports for AI Insights)
- Not in demo mode
Disabling a Plugin
Process:- Find enabled plugin card (green “Enabled” badge)
- Click “Disable” button (secondary gray)
- Confirmation: Plugin disabled
- Plugin status changes to “Disabled” (gray badge)
- Feature disappears from pages (e.g., no AI Insights in Reports)
Reversible: Disabling a plugin removes features but preserves configuration. Re-enabling restores settings.
Configuring a Plugin
Available for:- AI Insights for Reports
- Cash Flow Visualization
- SocialDeepDive
- Find enabled plugin card
- Click gear icon (⚙️) in card header
- Configuration modal opens
- Adjust settings
- Click “Save Configuration”
- Settings applied immediately
Plugin Cards
Grid layout (2 columns on desktop, 1 on mobile) with detailed plugin information.Card Structure
Card Header:- Plugin Name (title)
- Configure button (gear icon, if applicable)
- Edit Prompt button (ellipsis icon, super admin only, AI Insights)
- Description: What the plugin does
- Author: Plugin creator (if specified)
- Status: Enabled (green) or Disabled (gray) badge
- Health: Health status (if enabled)
- Healthy (green checkmark)
- Degraded (yellow warning)
- Unhealthy (red error)
- LLM Provider: Current AI provider (AI Insights only)
- Plan Warning: Yellow box if plugin not in current plan
- Enable button (primary blue) - If disabled
- Disable button (secondary gray) - If enabled
- Upgrade Required button (disabled) - If not in plan
Health Indicators
Healthy:- Green badge + green checkmark icon
- Plugin functioning normally
- No issues detected
- Yellow badge + yellow warning icon
- Plugin working but with issues
- May have reduced functionality
- Health message explains issue
- Red badge + red error icon
- Plugin not functioning properly
- Feature may be unavailable
- Health message explains error
- Gray badge + clock icon
- Health status not checked
- Recent enable or disable
Auto-Check: Plugin health is checked automatically. Refresh page to see latest status.
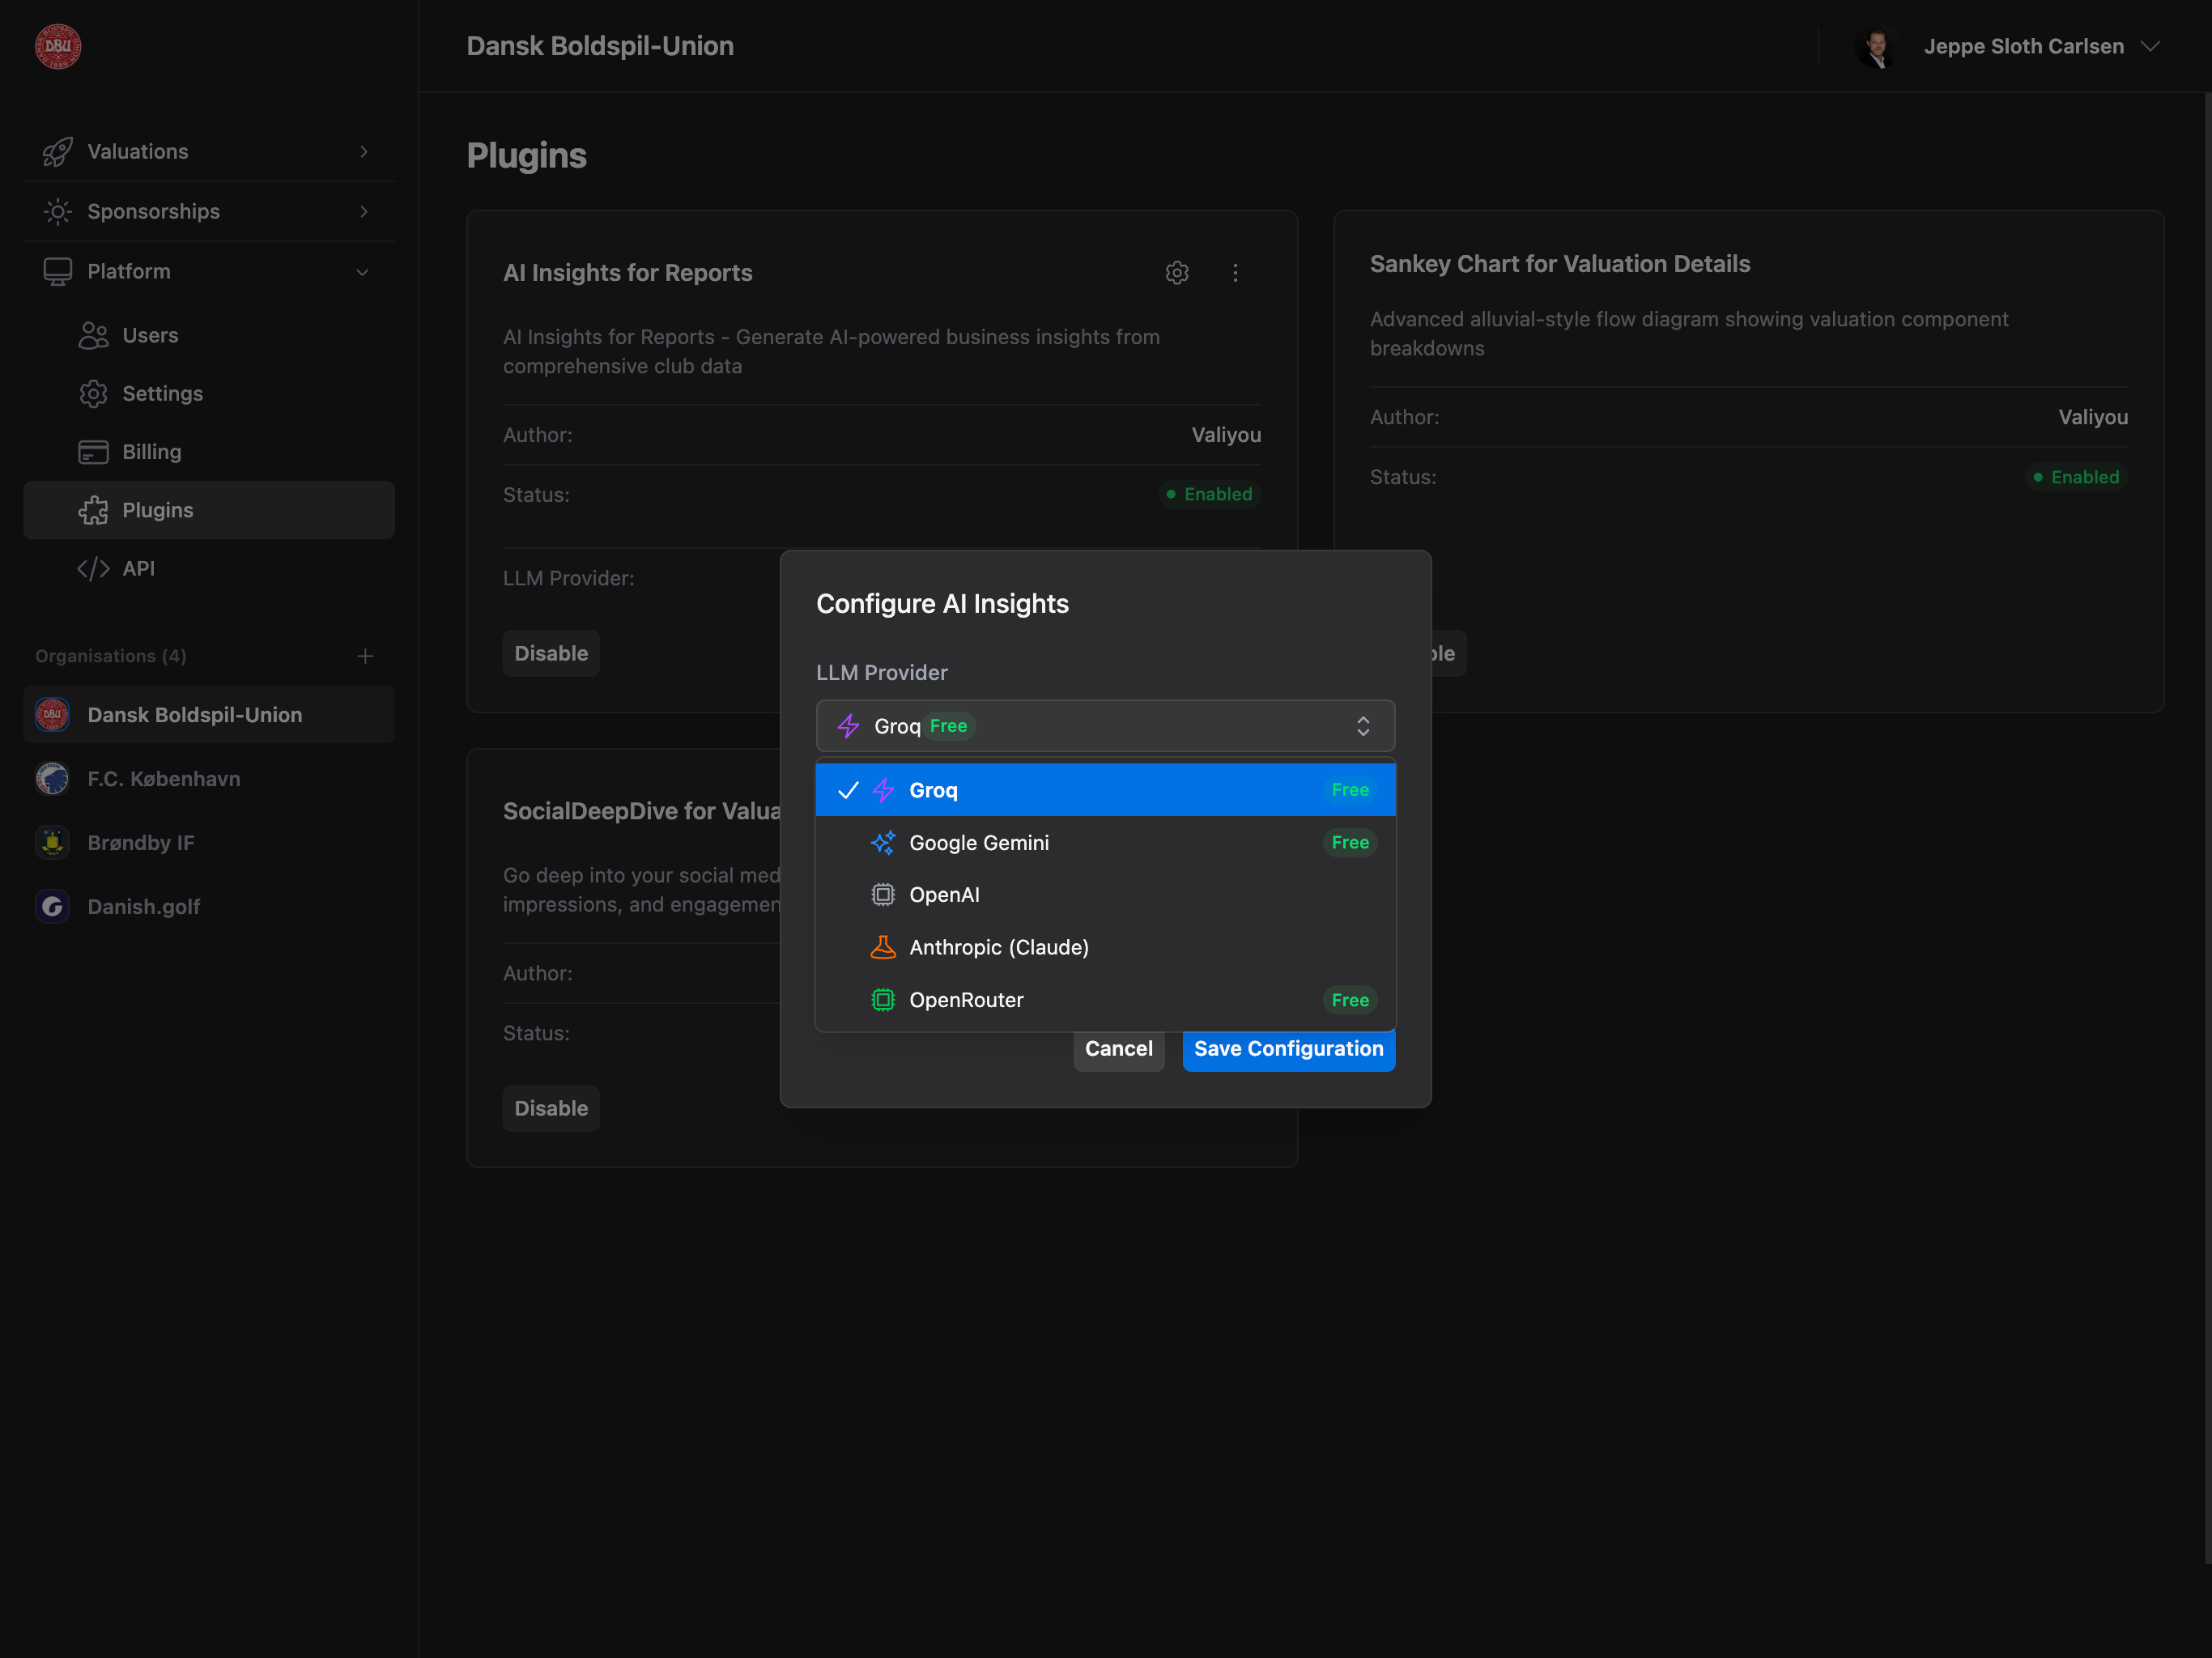
Configuration Modals
AI Insights Configuration
Modal Structure:- Title: “Configure AI Insights for Reports”
- LLM Provider dropdown with icons:
- Groq (purple bolt icon, “Free” badge)
- Google Gemini (blue sparkle icon, “Free” badge)
- OpenAI (gray chip icon)
- Anthropic/Claude (orange beaker icon)
- OpenRouter (green chip icon, “Free” badge)
- Model dropdown (provider-specific models with badges):
- Badges: Free, Recommended, Latest, Fast, Powerful
- API Key input (SecretInput with view/hide/copy)
- Changes based on provider selection
- Placeholders: sk-…, sk-ant-…, gsk_…, AIza…, sk-or-…
- Warning alert (if API key missing)
- Cancel and “Save Configuration” buttons
- API key required for selected provider
- Warning shown if missing: “Please enter a valid [Provider] API key before saving.”
- Cannot save without API key
- llama-3.3-70b-versatile (Recommended, Free)
- mixtral-8x7b-32768 (Free)
- gemma2-9b-it (Fast, Free)
- gemini-2.0-flash-exp (Latest, Free)
- gemini-1.5-pro (Recommended, Free)
- gemini-1.5-flash (Fast, Free)
- gpt-4o (Recommended)
- gpt-4o-mini (Fast)
- gpt-4-turbo
- claude-3-5-sonnet-20241022 (Recommended)
- claude-3-5-haiku-20241022 (Fast)
- claude-3-opus-20240229 (Powerful)
- Multiple models with free tier access
Cash Flow Visualization Configuration
Modal Structure:- Title: “Configure Cash Flow Visualization”
- Chart Type dropdown:
- Sankey (Alluvial Flow) - Recommended
- Waterfall
- Custom
- Chart Height input (number, pixels)
- Color Scheme dropdown:
- Default (Multi-color)
- Blue
- Green
- Purple
- Custom
- Chart Position dropdown:
- Before Sales Details - Recommended
- After Sales Details
- Top of Page
- Bottom of Page
- Checkboxes:
- ☑ Show Legend
- ☑ Show Tooltips
- ☑ Show Labels
- ☑ Enable Interactivity
- Animation Duration input (number, milliseconds)
- Cancel and “Save Configuration” buttons
- Chart Type: Sankey
- Height: 600px
- Color Scheme: Default (multi-color)
- Position: Before Sales Details
- All checkboxes: Checked
- Animation: 300ms
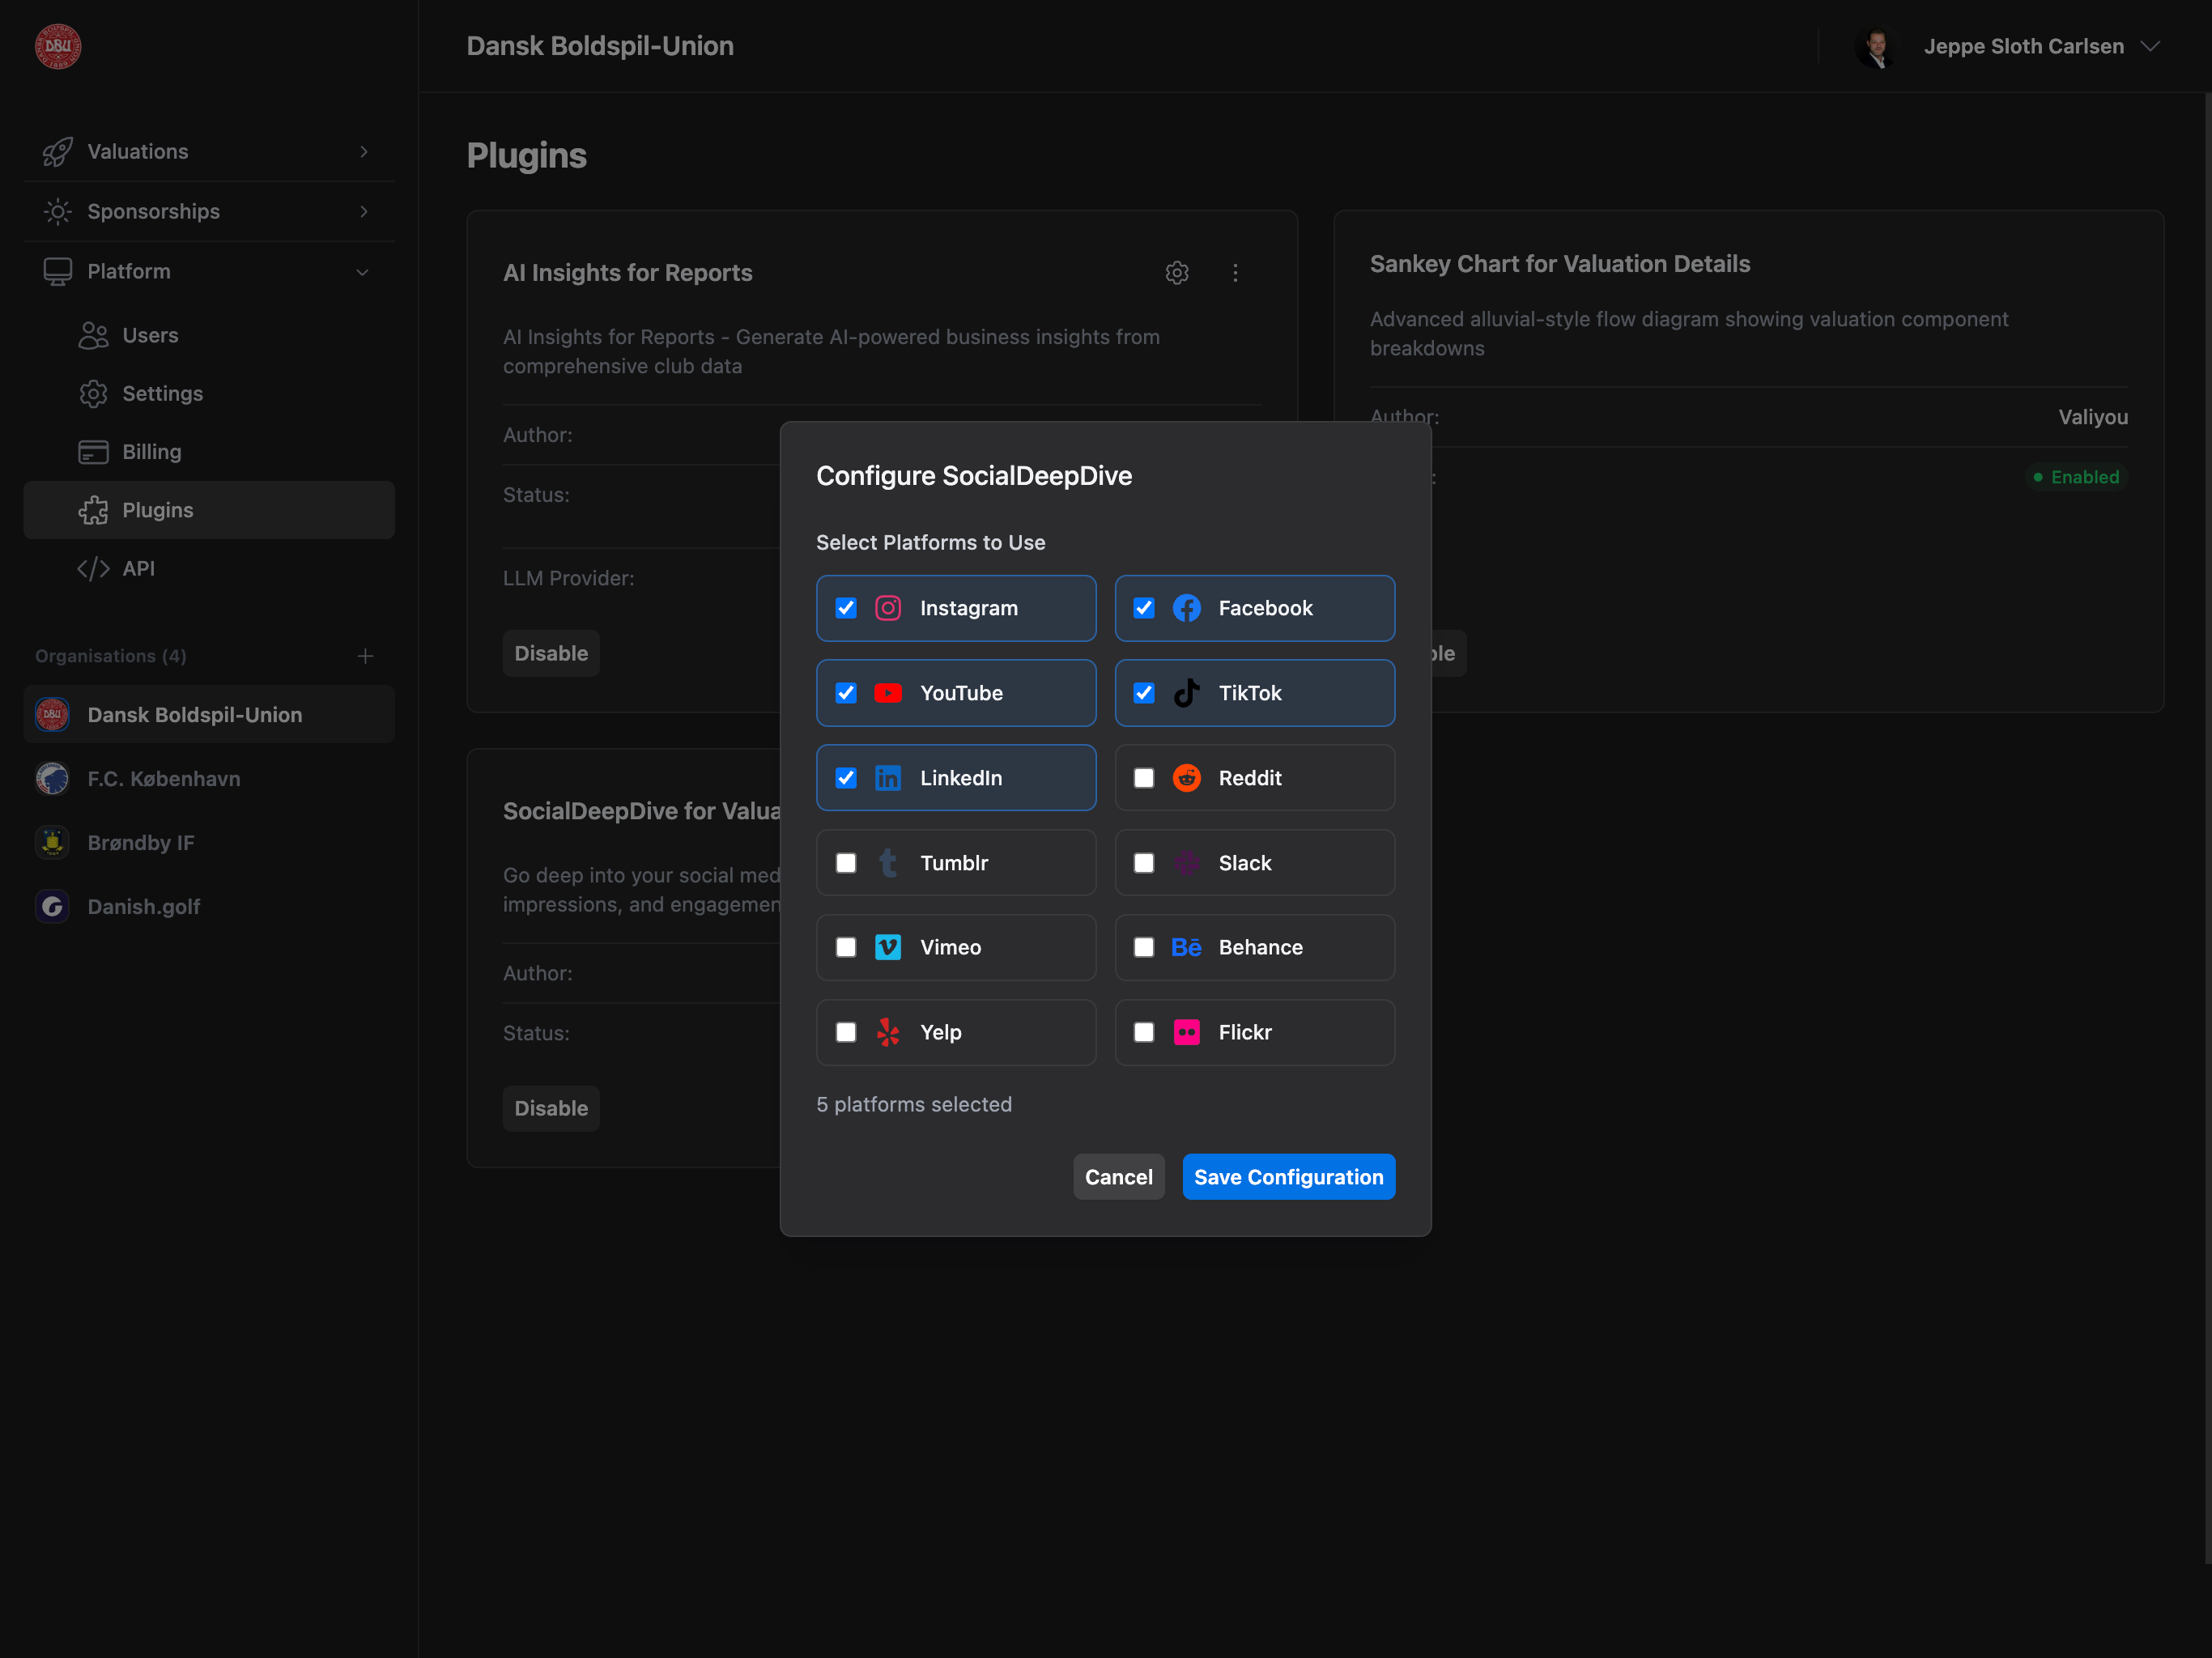
SocialDeepDive Configuration
Modal Structure:- Title: “Configure SocialDeepDive”
- Separate specialized modal
- Platform selection checkboxes
- Platform-specific settings
- Cancel and “Save Configuration” buttons
- ☑ YouTube
- ☑ TikTok
- ☑ Tumblr
- ☑ Slack
- ☑ Vimeo
- ☑ Behance
- ☑ Yelp
- ☑ Flickr
Default: All platforms enabled by default. Uncheck to disable specific platforms.
Permissions
| Plugin | Plan Required | Permission Required | Can Configure |
|---|---|---|---|
| Universal CSV Importer | Professional/Enterprise | Sponsors (write) | No |
| AI Insights | Professional/Enterprise | Reports + Plugins | Yes |
| Cash Flow Visualization | Professional/Enterprise | Plugins | Yes |
| SocialDeepDive | Professional/Enterprise | Plugins | Yes |
Admin Access: Admins can always enable/disable/configure all plugins regardless of specific permissions.
Where Plugins Appear
Universal CSV Importer
- Location: Sponsorships → Sponsors page
- Section: “Import from CSV” button (top right)
- Trigger: Click import button
- See: Universal CSV Importer
AI Insights
- Location: Valuations → Reports page
- Section: AI Insights (after enabling plugin and selecting valuations)
- Trigger: Compare 2+ valuations
- See: Valuations → Reports
Cash Flow Visualization
- Location: Valuations → Valuation Details page
- Section: Sales section (or configured position)
- Trigger: View any valuation
- See: Valuations → Valuation Details
SocialDeepDive
- Location: Valuations → New Valuation, Valuation Details
- Section: Social media data input/analysis
- Trigger: Creating or viewing valuations
- See: Valuations → Create Valuation
Common Use Cases
Setting Up AI Insights (Free)
- Navigate to Platform → Plugins
- Find “AI Insights for Reports” card
- Click “Enable” button
- Wait for status to change to “Enabled”
- Click gear icon (⚙️) in card header
- Select “Groq” (free) or “Google Gemini” (free)
- Select recommended model (free badge)
- Enter API key (get from Groq or Google AI Studio)
- Click “Save Configuration”
- Go to Valuations → Reports
- Select 2+ valuations
- See AI Insights section with analysis
Customizing Sankey Chart
- Navigate to Platform → Plugins
- Find “Cash Flow Visualization” card
- If disabled, click “Enable” first
- Click gear icon (⚙️) in card header
- Adjust settings:
- Chart Type: Keep as Sankey
- Height: 800px (taller chart)
- Color Scheme: Blue (brand colors)
- Position: Before Sales Details
- Keep all checkboxes checked
- Click “Save Configuration”
- Open any Valuation Details page
- See customized Sankey chart
Disabling Unused Plugin
- Navigate to Platform → Plugins
- Find enabled plugin (green “Enabled” badge)
- Click “Disable” button
- Plugin status changes to “Disabled”
- Feature removed from pages
- Configuration preserved for future re-enable
Troubleshooting
Can’t Enable Plugin
Reasons:- Plugin not included in plan (upgrade required)
- No Plugins permission (request from admin)
- In demo mode (upgrade to paid plan)
- Missing required permission (e.g., Reports for AI Insights)
- Check plan tier (Professional/Enterprise required)
- Purchase plugin add-on: Platform → Billing
- Request Plugins permission from admin
- Upgrade from demo mode
- Request missing permissions (Reports, etc.)
Configuration Not Saving
Check:- API key provided (AI Insights)
- Valid format (numbers, no negatives for height/duration)
- Network connection stable
- Not in demo mode
- Ensure API key is complete (starts with correct prefix)
- Use positive numbers for pixel/millisecond values
- Refresh page and try again
- Check browser console for errors
Plugin Showing “Unhealthy”
Reasons:- API key invalid or expired (AI Insights)
- Service temporarily unavailable
- Rate limit exceeded
- Configuration error
- Re-enter API key (check validity)
- Wait and try again later
- Check usage limits on provider dashboard
- Re-configure plugin with correct settings
- Disable and re-enable plugin
AI Insights Not Appearing
Check:- Plugin enabled (green “Enabled” badge)
- Reports permission granted
- Professional/Enterprise plan active
- Multiple valuations selected (2+ required)
- API key configured correctly
- Enable AI Insights plugin
- Request Reports permission
- Upgrade plan
- Select at least 2 valuations
- Reconfigure API key
Sankey Chart Not Showing
Check:- Plugin enabled
- Professional/Enterprise plan
- Viewing Valuation Details page (not list)
- Chart position setting (might be bottom of page)
- Enable Cash Flow Visualization plugin
- Upgrade plan
- Open a single valuation details page
- Check configuration position setting
- Scroll down if position set to bottom
Next Steps
Enable AI Insights
Get free API keys and try AI-generated insights
Customize Sankey
Adjust visualization to match your brand
Explore SocialDeepDive
Enable for future social media features
Import from CSV
Import sponsors and contacts from CRM systems
View Reports
Use AI Insights in your valuation reports