Overview
Plan Required: Professional or Enterprise plan
Permission Required: Automatically available with plan
Chart Types
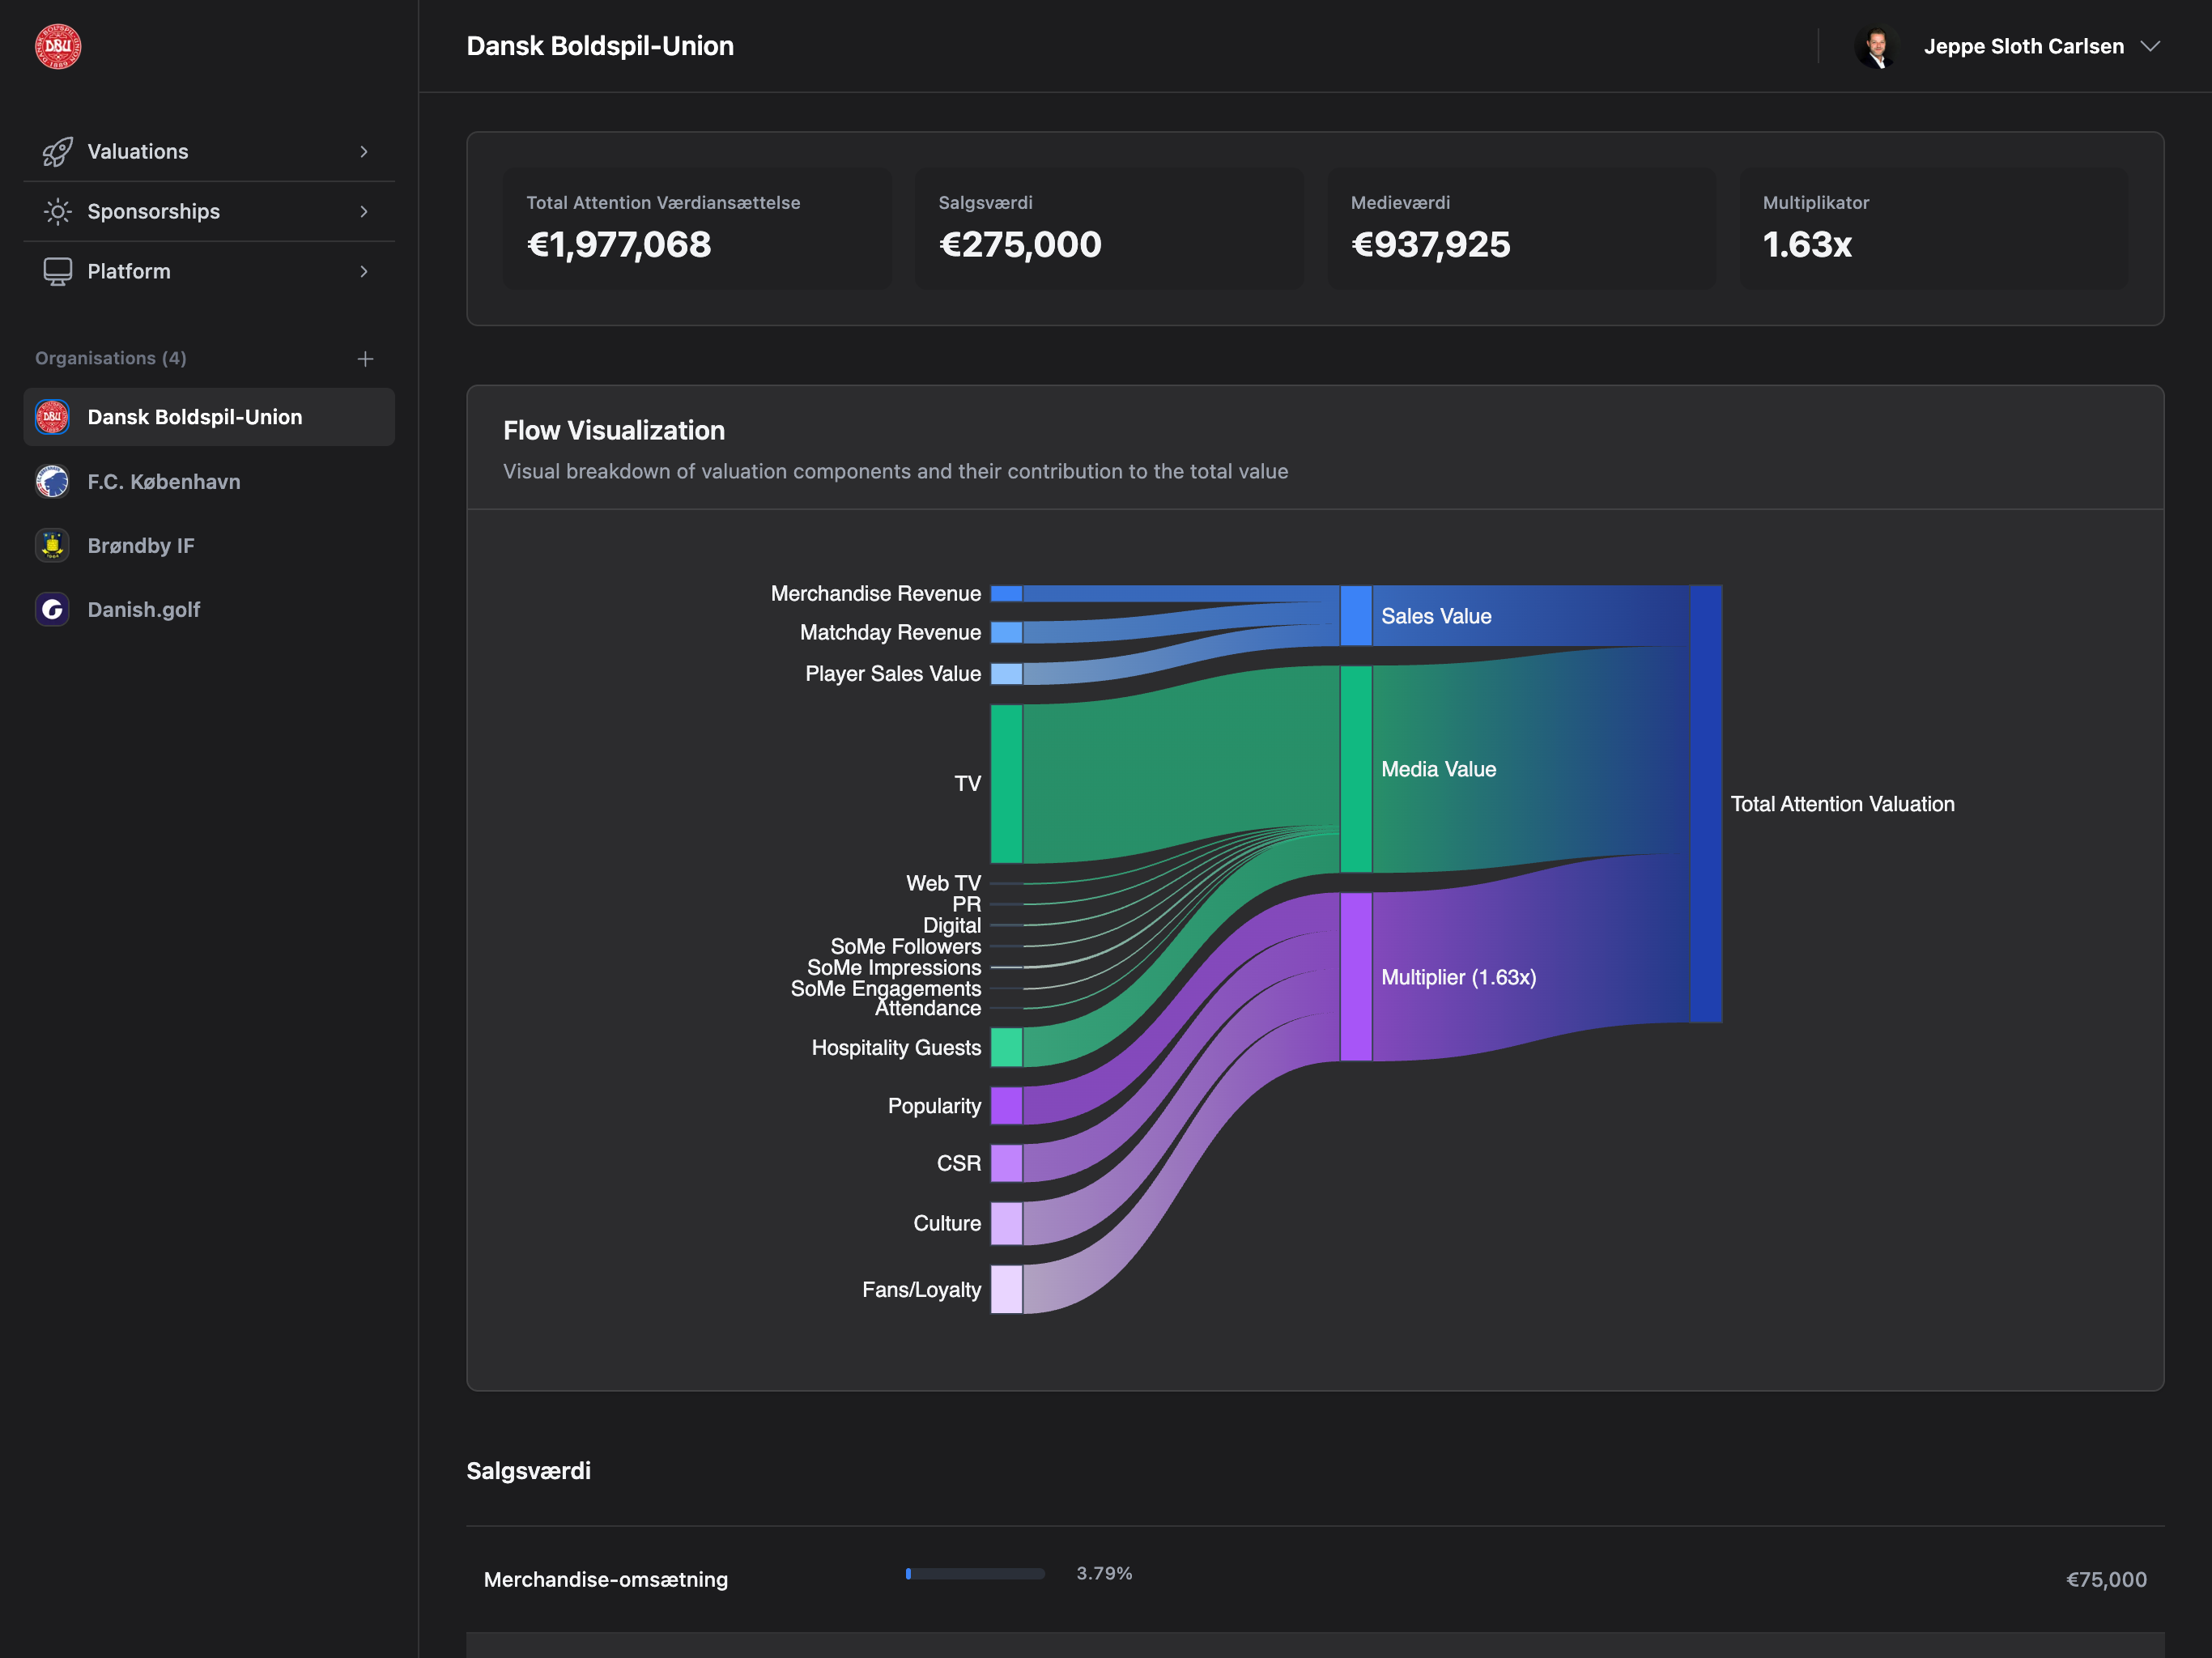
Sankey (Alluvial Flow) - Recommended

- Flow of revenue from sources to categories to total
- Visual representation of how different revenue streams contribute
- Width of flows proportional to amounts
- Interactive hover tooltips with exact values
- Visualizing revenue composition
- Identifying major revenue sources
- Understanding value distribution
- Professional presentation
Waterfall

- Sequential breakdown of revenue components
- Cumulative effect of each category
- Step-by-step buildup to total valuation
- Sequential analysis
- Traditional financial reporting
- Showing incremental contributions
Custom
Configure your own visualization style with custom settings.Configuration
Step 1: Enable Plugin
- Navigate to Platform → Plugins
- Find “Cash Flow Visualization (Sankey)” card
- Click “Enable” button
- Wait for status to change to “Enabled”
Step 2: Configure Chart
- Click gear icon (⚙️) in plugin card header
- Configuration modal opens

Chart Type
- Sankey (Alluvial Flow) - Recommended
- Waterfall - Traditional waterfall chart
- Custom - Custom visualization
Chart Height
- Number of pixels (default: 600px)
- Recommended range: 400-800px
- Larger height = more vertical space for flows
Color Scheme
- Default (Multi-color) - Different colors for each category
- Blue - Single color palette (blues)
- Green - Single color palette (greens)
- Purple - Single color palette (purples)
- Custom - Define your own colors
Chart Position
- Before Sales Details - Recommended, appears above sales breakdown
- After Sales Details - Appears below sales breakdown
- Top of Page - Very first element on page
- Bottom of Page - Very last element on page
Display Options
Checkboxes (all checked by default):- ☑️ Show Legend - Display color legend
- ☑️ Show Tooltips - Interactive hover tooltips
- ☑️ Show Labels - Data labels on flows
- ☑️ Enable Interactivity - Click/hover interactions
Animation Duration
- Milliseconds (default: 300ms)
- Recommended range: 100-500ms
- Higher value = slower, smoother animation
Step 3: Save Configuration
Click “Save Configuration” to apply changes.Using Cash Flow Visualization
Step 1: Navigate to Valuation Details
Go to Valuations → Click any valuationStep 2: Locate Sankey Chart

Step 3: Interact with Chart
Hover over flows:- See exact amounts and percentages
- Highlight specific revenue streams
- Tooltip shows: Source → Target: Amount (%)
- Focus on specific revenue stream
- Dim other flows for clarity
- Click again to reset
- Shows all categories and colors
- Click legend items to toggle visibility
- Useful for focusing on specific categories
What the Chart Shows
Revenue Sources
Sales Revenue:- Transfers (Player Sales)
- Merchandise Sales
- Ticket Sales
- Print Media
- Digital Media
- Social Media
- Broadcast Media
- Brand Exposure
- Sponsorship Coverage
- Marketing Value
Flow Structure
Customization Examples
Minimalist Configuration
Goal: Clean, simple chart with minimal distractions Settings:- Chart Type: Sankey
- Height: 500px
- Color Scheme: Blue
- Position: Before Sales Details
- Show Legend: ❌ Unchecked
- Show Tooltips: ✅ Checked
- Show Labels: ❌ Unchecked
- Enable Interactivity: ✅ Checked
- Animation: 200ms
Detailed Analysis Configuration
Goal: Maximum information for deep analysis Settings:- Chart Type: Sankey
- Height: 800px
- Color Scheme: Default (Multi-color)
- Position: Before Sales Details
- Show Legend: ✅ Checked
- Show Tooltips: ✅ Checked
- Show Labels: ✅ Checked
- Enable Interactivity: ✅ Checked
- Animation: 300ms
Presentation Mode
Goal: Professional for client presentations Settings:- Chart Type: Sankey
- Height: 700px
- Color Scheme: Purple (brand colors)
- Position: Top of Page
- Show Legend: ✅ Checked
- Show Tooltips: ✅ Checked
- Show Labels: ✅ Checked
- Enable Interactivity: ❌ Unchecked (static)
- Animation: 500ms (smooth)
Benefits
Visual Clarity
Understand revenue composition at a glance
Professional Presentation
Impress stakeholders with interactive visualizations
Interactive Exploration
Drill down into specific revenue streams
Customizable Appearance
Match your brand colors and style
Troubleshooting
Sankey Chart Not Showing
Check:- ✅ Plugin enabled (green “Enabled” badge)
- ✅ Professional/Enterprise plan active
- ✅ Viewing Valuation Details page (not list)
- ✅ Chart position setting (might be bottom of page)
- Enable Cash Flow Visualization plugin
- Upgrade plan if needed
- Open a single valuation details page
- Check configuration position setting
- Scroll down if position set to bottom
Chart Too Small/Large
Problem: Chart height doesn’t fit your needs Fix:- Open plugin configuration
- Adjust Chart Height value:
- Too small: Increase to 700-800px
- Too large: Decrease to 400-500px
- Save configuration
- Refresh valuation page
Colors Don’t Match Brand
Problem: Default colors don’t match your brand Fix:- Open plugin configuration
- Select Color Scheme:
- Blue: Corporate blue palette
- Green: Success/growth theme
- Purple: Premium/luxury theme
- Custom: Define your own (future)
- Save configuration
Chart Not Interactive
Problem: Hover/click not working Fix:- Open plugin configuration
- Check Enable Interactivity is checked ✅
- Save configuration
- Refresh valuation page
- Clear browser cache if still not working
Chart Blocks Other Content
Problem: Chart takes up too much space Fix:- Open plugin configuration
- Reduce Chart Height to 400-500px
- Uncheck Show Legend if not needed
- Uncheck Show Labels to reduce clutter
- Save configuration
Best Practices
1. Choose Right Chart Type
Use Sankey when:- ✅ Visualizing revenue flow
- ✅ Showing relationships between sources
- ✅ Professional presentations
- ✅ Interactive exploration needed
- ✅ Sequential breakdown preferred
- ✅ Traditional financial reporting
- ✅ Showing incremental contributions
2. Optimize Chart Height
Guidelines:- 400-500px: Compact view, less scroll
- 600px: Default, balanced
- 700-800px: Detailed view, more vertical space
- 900px+: Only for large screens, presentations
3. Balance Interactivity
Enable all options for:- Internal analysis
- Data exploration
- Training purposes
- Client presentations (disable labels)
- Print/PDF export (disable interactivity)
- Minimal design (disable legend)
4. Match Your Brand
Use consistent colors across all valuations:- Choose color scheme that matches brand
- Save configuration
- All valuations use same style
- Professional, consistent appearance
5. Position Strategically
Before Sales Details (default):- ✅ Immediate visual impact
- ✅ Sets context for detailed breakdown
- ✅ Most logical flow (overview → details)
- ✅ Reinforces detailed numbers
- ✅ Summary visualization
- ✅ Maximum visibility
- ✅ First thing users see
- ✅ Doesn’t distract from main content
- ✅ Optional exploration
FAQ
Can I hide the Sankey chart on specific valuations?
Can I hide the Sankey chart on specific valuations?
No, the plugin applies to all valuations when enabled. To hide:
- Disable the plugin temporarily
- Or position it at bottom of page
- Future: Per-valuation toggle planned
Does the chart update when I edit valuation data?
Does the chart update when I edit valuation data?
Yes! The chart is generated from live valuation data. When you update sales, media, or brand values, the chart automatically reflects the changes on page refresh.
Can I export the Sankey chart as an image?
Can I export the Sankey chart as an image?
Not directly. To export:
- Take screenshot of chart
- Or use browser print-to-PDF (includes chart)
- Or right-click chart → “Save image as” (if available)
Why is my chart all one color?
Why is my chart all one color?
You selected a single-color palette (Blue, Green, or Purple). To get multiple colors:
- Open plugin configuration
- Select Default (Multi-color) color scheme
- Save configuration
Can I customize individual flow colors?
Can I customize individual flow colors?
Not yet. Current color schemes:
- Default: Automatic color assignment
- Blue/Green/Purple: Single palette
Does the chart work on mobile?
Does the chart work on mobile?
Yes! The chart is responsive and works on mobile devices. However:
- Smaller screen = less detail visible
- Touch interactions replace hover
- Consider reducing height for mobile (automatic)
Related Documentation
- Plugins Overview - All available plugins
- Valuation Details - Full valuation page guide
- Create Valuation - How to create valuations
- Reports - Multi-valuation comparison